|
|
Seabed analysis |
|
|
|
Preparation and analysis:
TerraNor has developed routines to prepare panchromatic and colour images for analysis. Without our routines it is not possible to analyse seabed images by machines.
From bathymetry and backscatter data we have developed routines in eCognition to create derivatives and analyze. It is almost 'one button push and go'.
|
|
|
|
Classification of fauna |
|
|
|
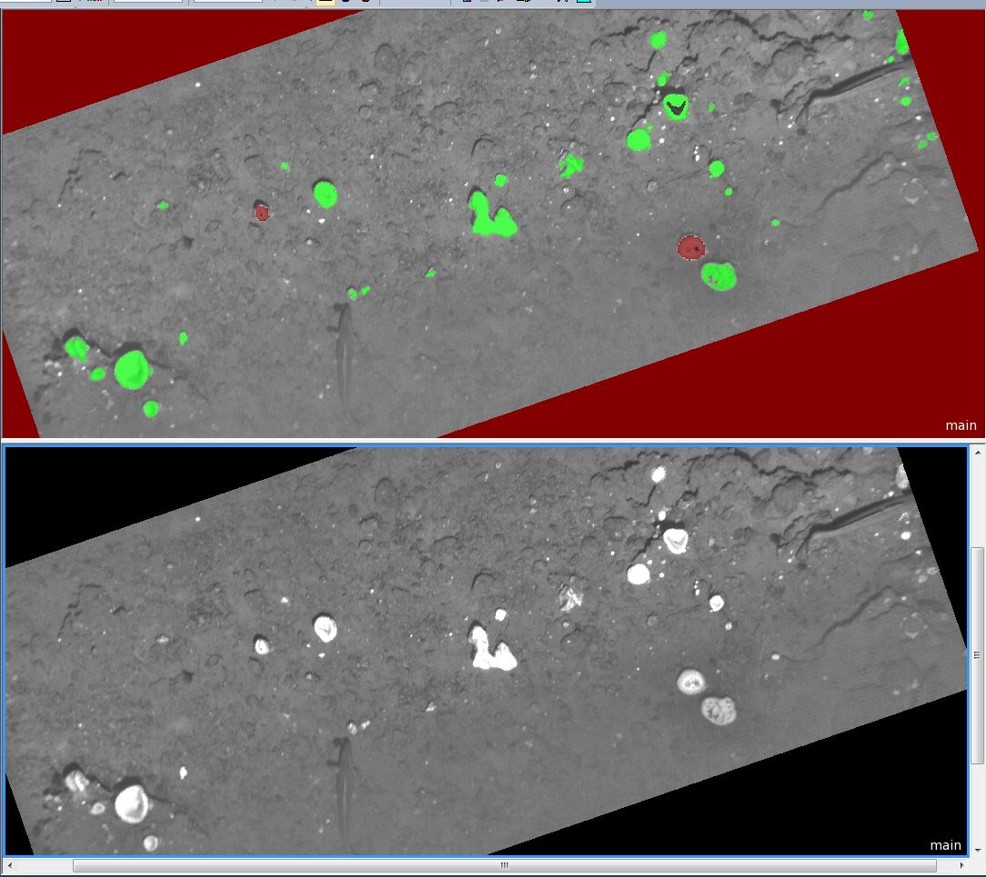
We analyzed 10 000 Panchromatic images in eCognition and could automatically identify Crust, Gas, Coral, Anemone and Sponges. For most images we could only distinguish fauna as such and not the difference between Sponges and Anemone. Still it was very useful to list out which images that contained fauna and which did not. Corall seemed to be very easy to detect.
|
|
|
|
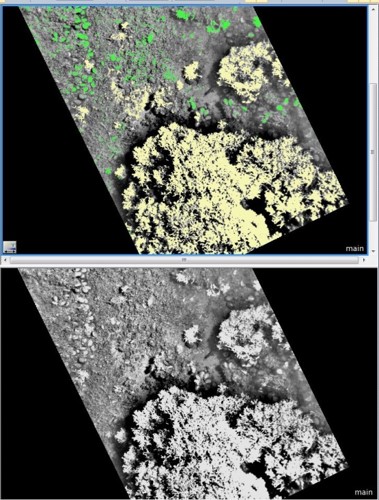
Sponges Geodia |
|
|
|
 |
|
|
|
Coral |
|
|
|
 |
|
|
|
|
|
|
|
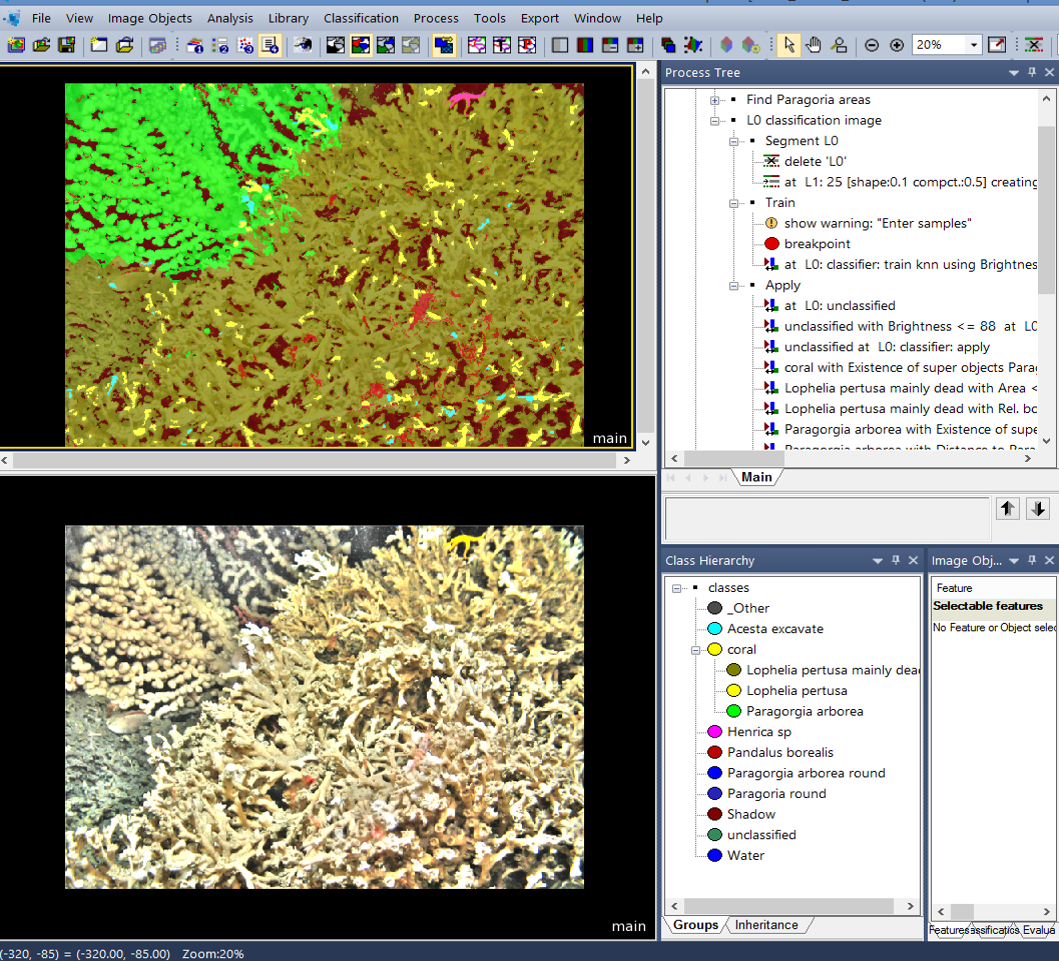
Gardline coral image classified in eCognition: |
|
|
|
 |
|
|
|
Without enhancement we could not analyze the colour images. |
|
|
|
Bathymetry: |
|
|
|
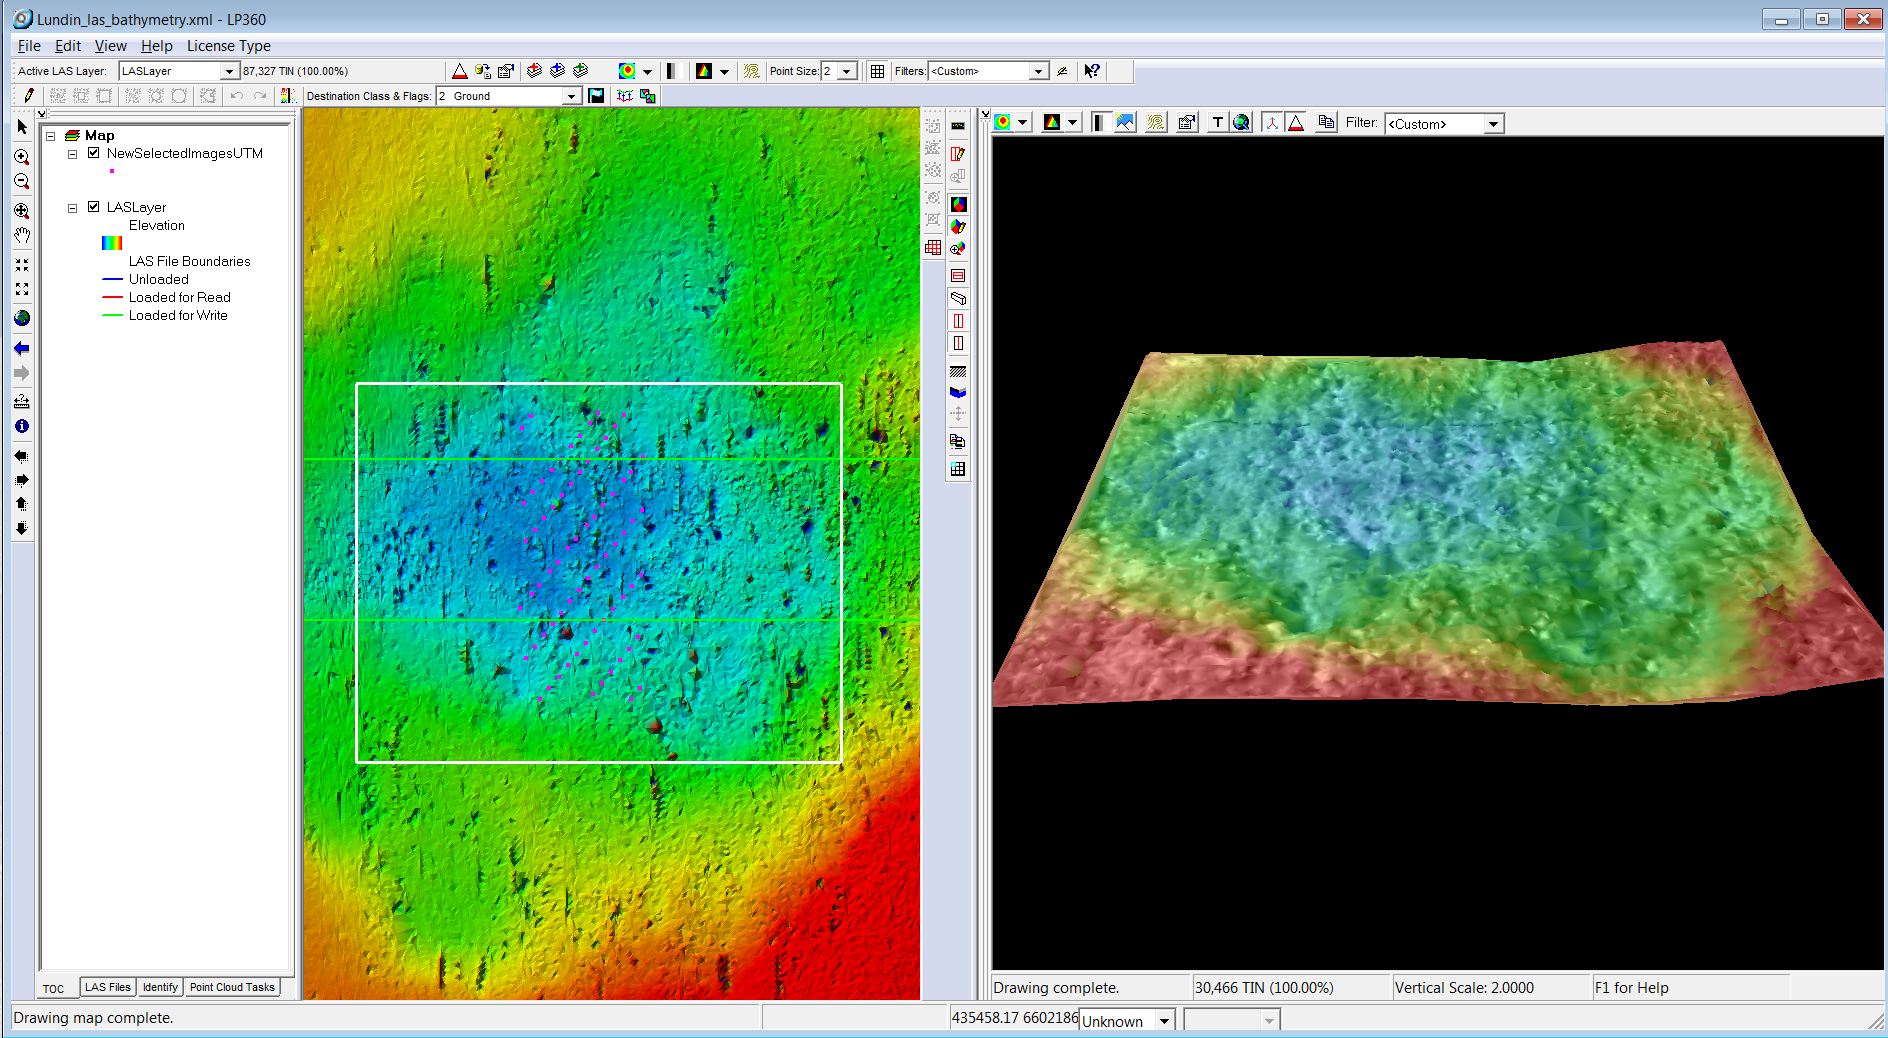
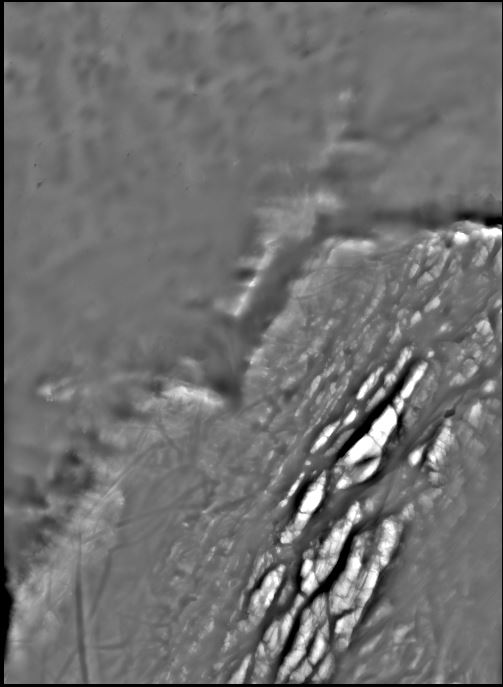
Analysis of terrain is often done by visuliasation. Low areas are blue and high areas are red. These simple analysis can easily show small differences on the seabed. Analysis do not always require advanced processing. Below are some examples of bathymetry derivatives. |
|
|
|
 |
|
|
|
Aspect view created automatically in eCognition |
|
|
|
 |
|
|
|
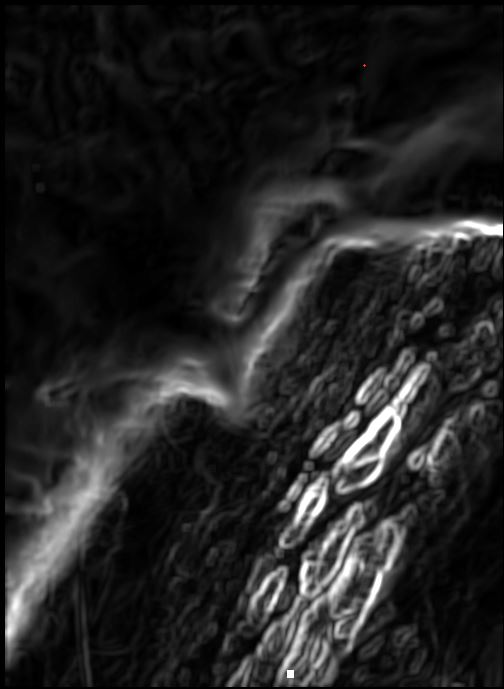
BPI: Bathymetric position index automatically created in eCognition: |
|
|
|
 |
|
|
|
Roughness automacially created in eCognition: |
|
|
|
 |
|
|
|
|
|
|
|
|
|