Satellite imagery examples
we will add more...
|
Explanations |
-Pan: Panchromatic, black/white, greyscale
-MS: Multispectral, colours, 4 to 30 or more channels.
-Channel: values measured in one frequency range for each pixel on ground.
-Pixel:images are divided into square pixels that cover a rectangle on the ground.
-GSD: ground sample distance: distance between pixel centers measured on the ground.
-Data format: normally data are captured in 12 bit and delivered in 16 bit data format. This is sensor dependant.
-Optical: measure sun light returned from ground, passive sensor.
-Radar: send out radio beams and measure return signal, active sensor.
-Lidar/laser: sends out light beams and measure the return signals (one or many returns pr beam), active sensor.
-Raster files: data delivered as pixels in rectangular format. Normal for satellite images.
-Lidar/Las files: data delivered as points with lots of info pr point.
|
|
|
|
|
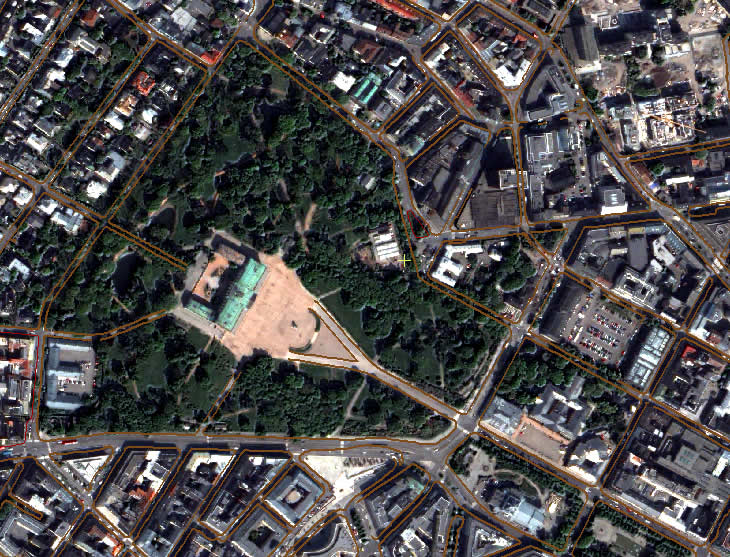
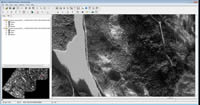
QuickBird, Oslo City 2004
We used PCI Geomatica to pansharpen the 2.44 m colour channels to create a 0.61 m colour image based on the 0.61 m Pan channel. |
|
|
|
|
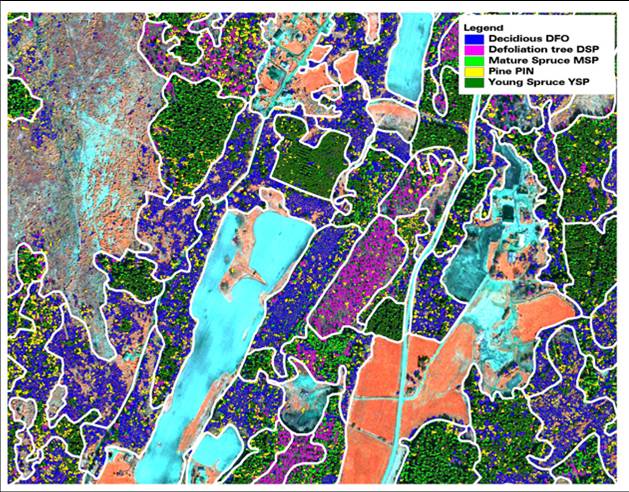
Maridalen QB 2004, forest species
The same QuickBird image was used to classify and segment single trees in a forest outside Oslo, in Maridalen. 0.61 m is excellent for single tree classification of mature forests.
It is easy to calculate size of single trees from satellites and by that calculate quality, volume and number of trees. Read the whole story:
here
|
|
|
|
|
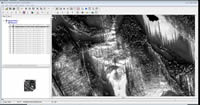
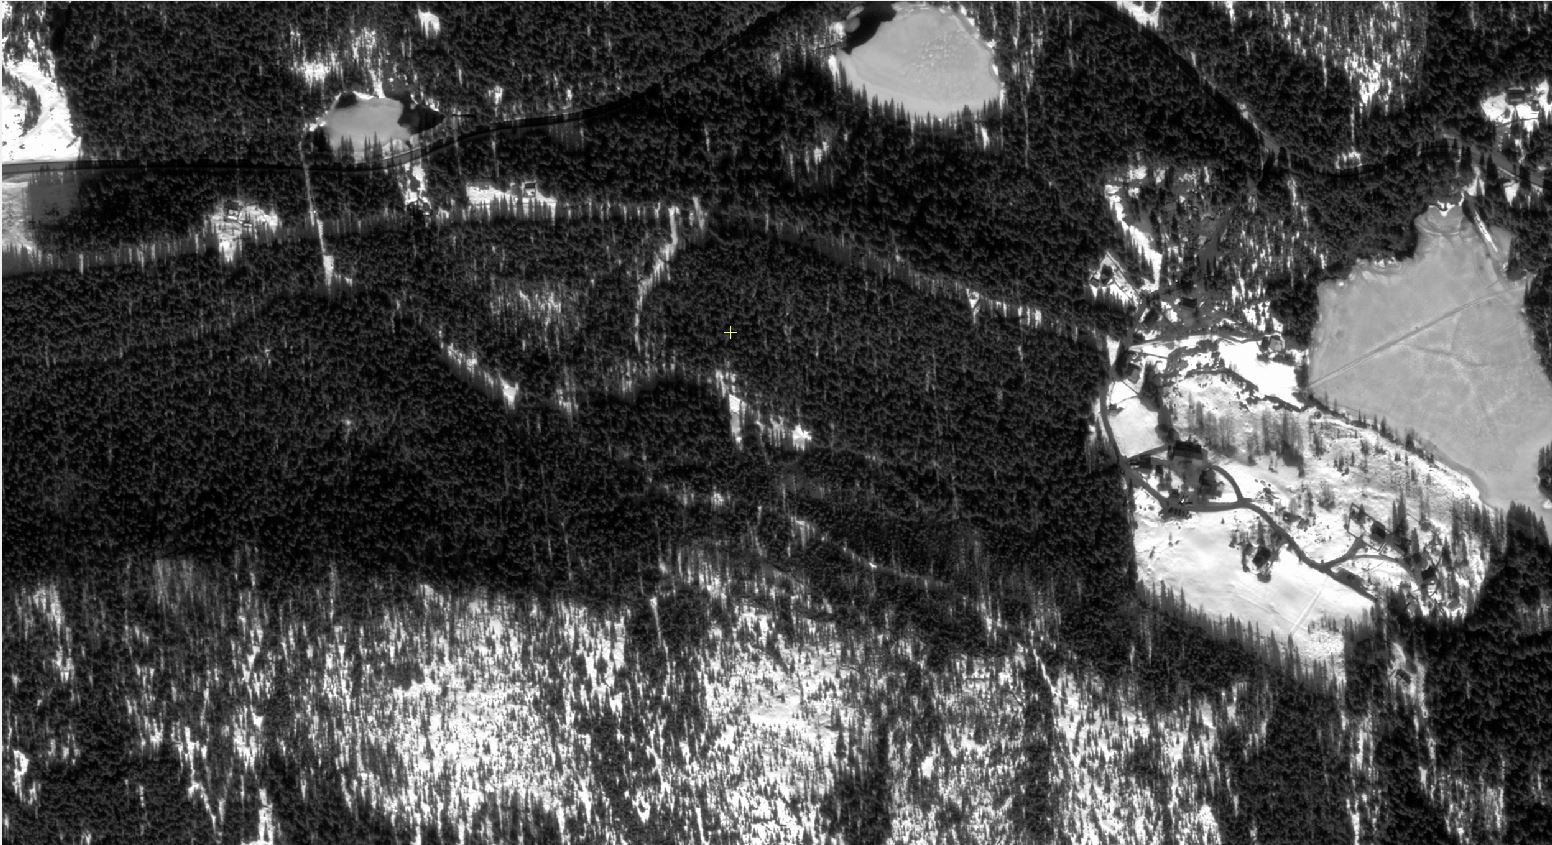
WorldView 1 Pan images from storm Ivar in Dec 2013
In January 2014 TerraNor helped Swedish foresters to detect windfall after the heavy storm Ivar. The storm came mid winter and blew down lots of timber. To be able to log the windfalls and bring them out of forest, they needed |
|
to find the areas with windfall.
Most of the roads were not plowed and access was limited so the foresters could not get an overview of the problems.
|
|
The solution was to use High resolution satellite WorldView 1. Normally it is not to collect satellite imagery so far north in Sweden in January, so this was a test job.
The sun is of course very low on the sky, and the shadows are long. |
|
Thanks to newfallen snow, the reflection of sunlight was strong enough to give a good Pan image.
We tried Colour (MS) too, but found that there are no colours outdoor in Sweden and Norway in mid winter.
MS channels had too little light to show any results at all. |
|
European Space Imaging did a great job in collecting the data from the DG satellite WorldView 1.
What can we learn from this:
Pan images can be taken the whole year in Nordic countries below the arctic circle.
Fresh fallen snow improves the result. |
|
Click on the images to see a larger image. |
|
|
|
|
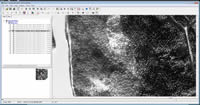
WorldView 2
February 15th, 2014, a heavy snow fall broke the top of 5% of the mature trees in higher areas (abone 300m).
Viken forest owner assosiation ordered this image taken in April 2014. It turned out to be too late. It was in the middle of spring and much of the snow had melted on the ground. It was difficult to see the single fallen trees, but we could confirm that larger areas had not been broken; only single trees. |
|
|
|
|
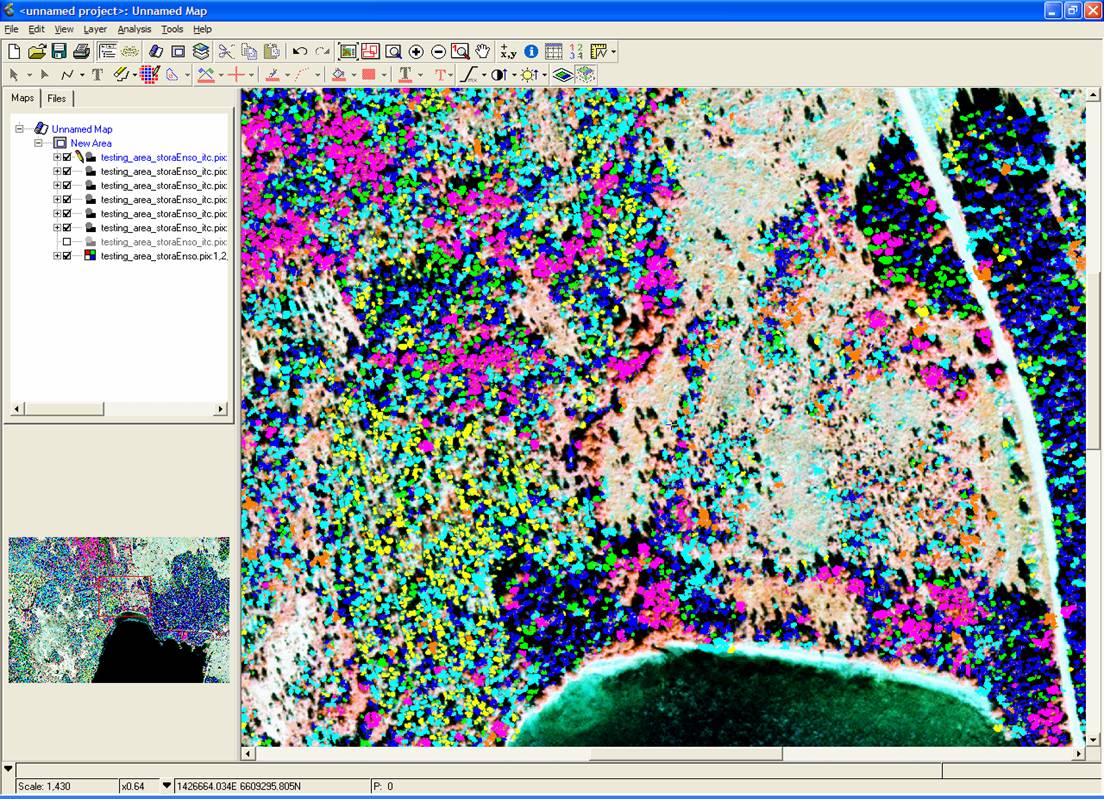
Gremeniella attach Stora Enso
This shows what is possible to do with high resolution satellite imagery. With 50 cm resolution we can detect different species and health for each single tree. Especially after attacks by fungis like Gremeniella this is important.
|
|
|
|
|
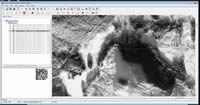
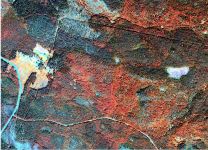
GeoEye 2011
The goal for this project was to detect sick and dead trees due to attacks from bark beetles. With this GeoEye 50cm image, it was easy to detect all the sick and dead trees.
Click on the image to see a larger version. IR colours make all trees with chlorophyll look read. Deciduous trees will look strongly read. Sick trees will have less chlorophyll and have more blue and green colours. Dead trees will look blue. It is interesting to see how easy we can see this from 770 km height! |
|
|
|
|
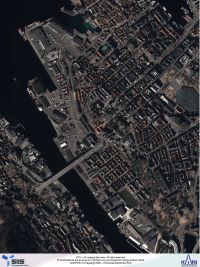
KOMPSAT-3
This 0.7m resolution image over Bergen shows the quality of Kompsat satellites. Click to see a large version of the image.
|
|
|
|
|
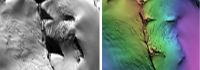
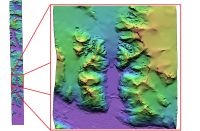
WorldView 2 Greenland
These 3 images show the beauty of satellite imagery and use of DTM. Data was captured by DigitaGlobe and processed in PCI Geomatica to create a DTM.
DTM models from stereo optical satellites have an excellent quality. Z accuracy is normally 5 times the size of the pixel. A pixel size of 0.5 m will give a Z-value accuracy of 2.5 m.
Even in forestry this is equal to or better than manual survey of forest stand height on the ground.
A terrain model from large areas of Greenland with this accuracy is almost impossible or very difficult to achieve with other methods.
Please notice that the quality of PCI Geomatica software. Automatic terrain modelling of stereo images from glaciers can only be done with high quality software like PCI Geomatica DEM extraction!
|
|
|
|
|
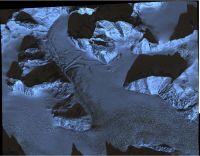
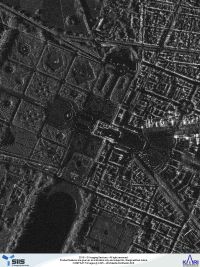
Kompsat 5
Radar sensors are different from optical. They send out beams that are reflected from the ground. The sensor detects the time it takes to send and receive the signal. This give the distance to ground. While z-value can be obtained with extreme accuracy, x and y values have less accuracy.
In addition to position, the sensor measure the strength of the signal, angle of the return signal and much more.
Radar data require special software to process the different data captured. PCI Geomatica has a wide library of functions to handle radar data in a good way.
|