|
|
Project descriptions
|
|
|
|
English: Some reports here are in Norwegian. If you are interested we can send you an English version. Please send a mail to post at terranor dot no. |
|
|
|
|
|
|
|
Contact TerraNor for more info. |
|
|
|
|
|
|
|
The BPI model |
|
|
|
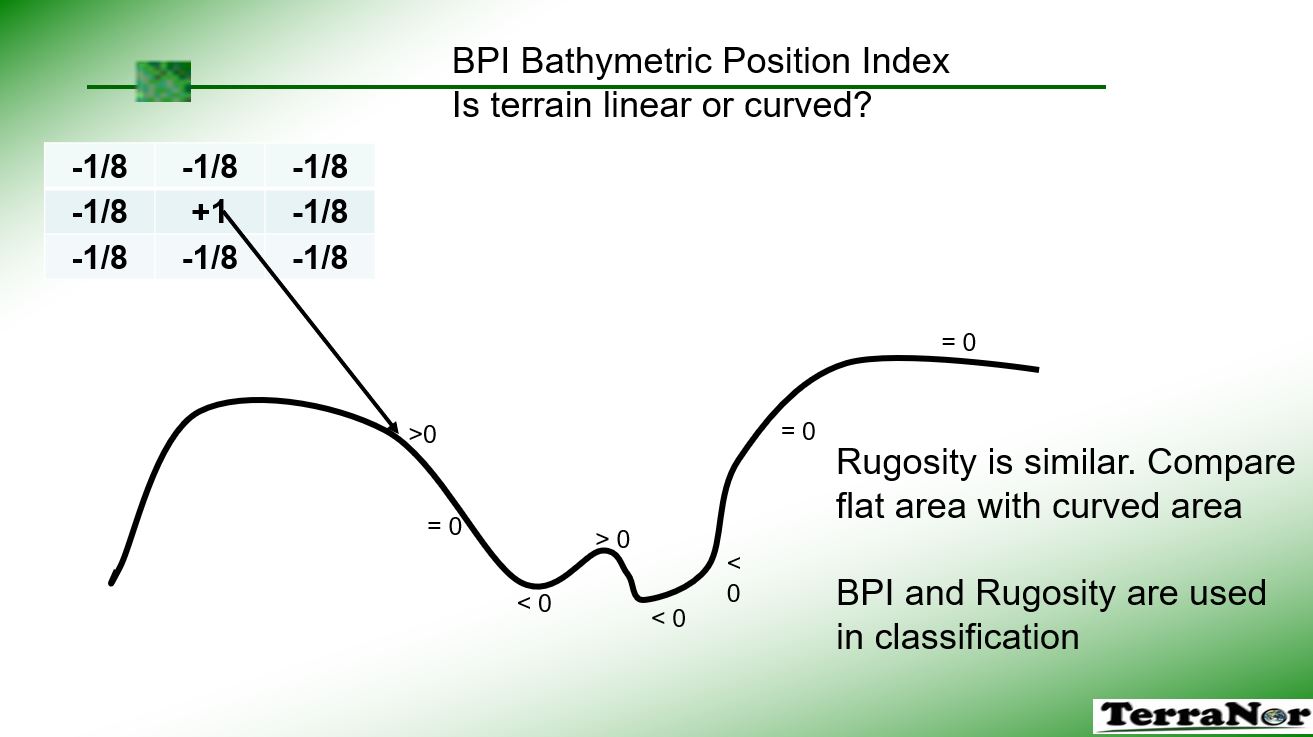
Bathymetric Positin Index (BPI)
describes the seabed terrain and comes from Terrain Position Index (TPI) used on land. It is a very powerful tool to define the terrain as straight or curved. It tells if the terrain is a top of a hill or bottom of a hole or on a straight area. A straight area can have a slope.
BPI is calculated by subtracting the average height (value) from the pixels around from the center pixel. It is possible to analyse large or small areas by using more or less number of pixels around the pixel being calculated. A value of 0 (zero) means straight terrain while negative or positive values means curved terrain. |
|
|
|
|
|
|
|
Processing one million images for Lundin |
|
|
Project for Lundin Norway, now part of Aker BP |

“Lundin sees the information that is gained through the extensive seabed mapping as relevant to
the whole E&P value chain."
|
|
|
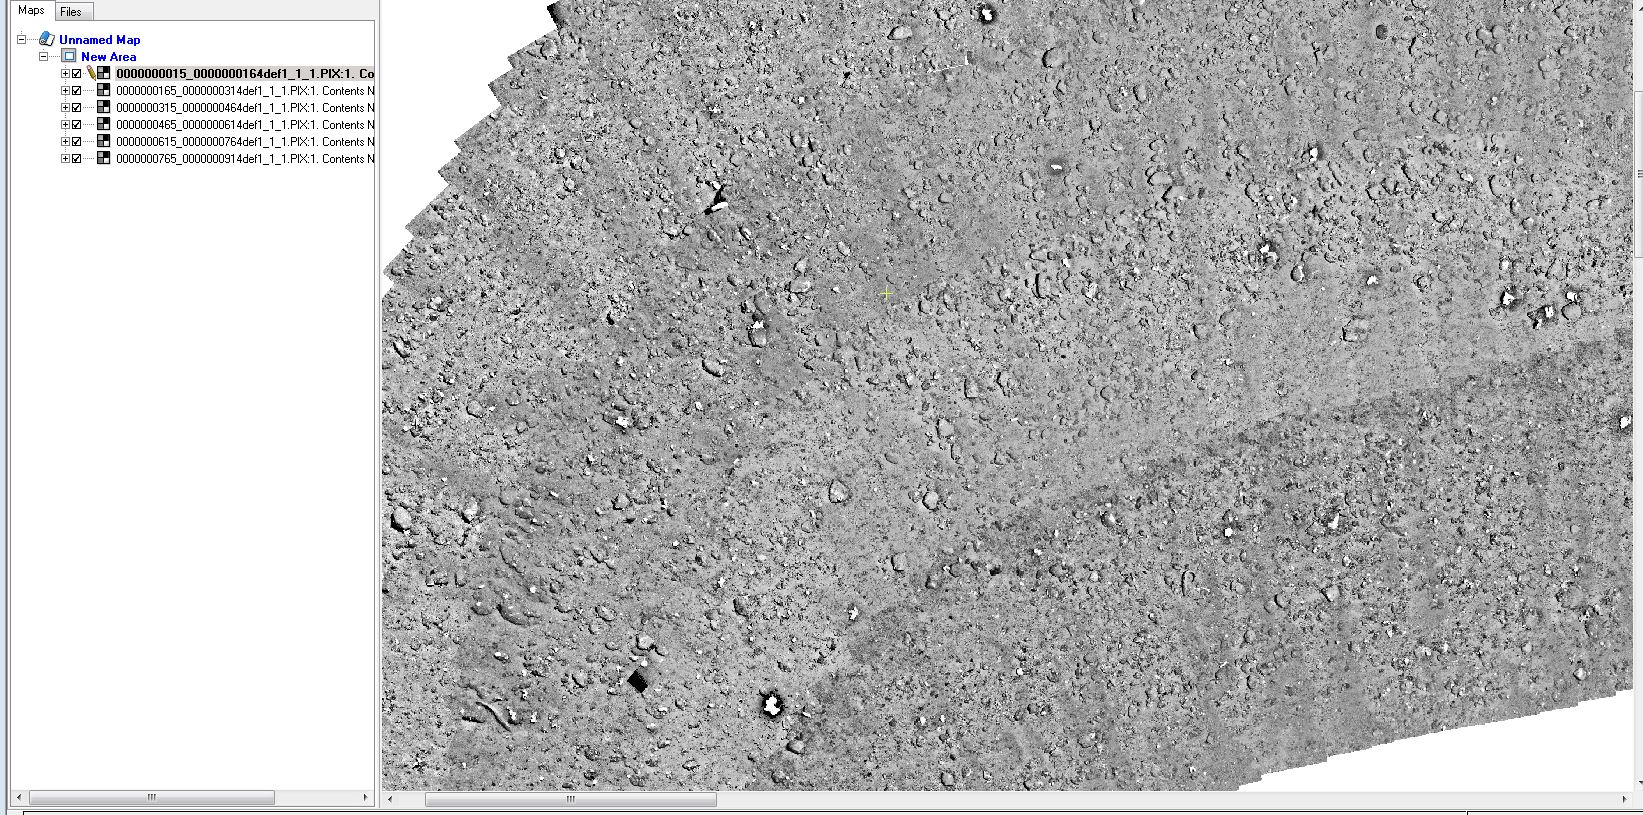
The problem with light in water |
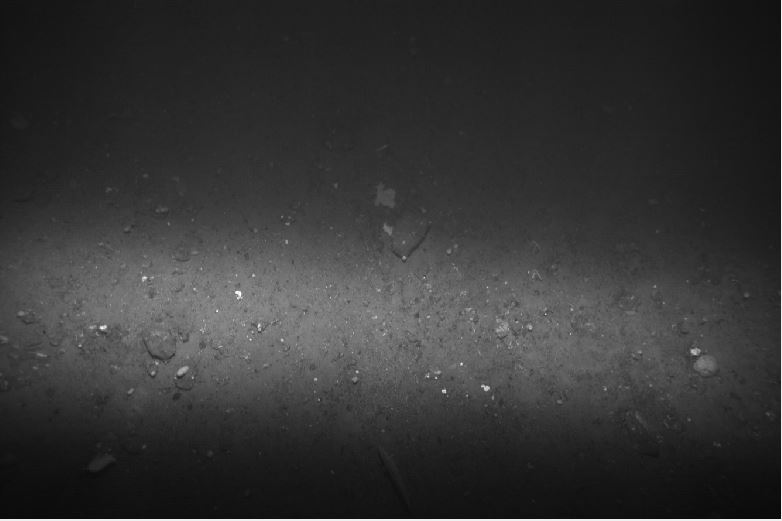
Image 164, original from camera.
In 2011 we had a meeting with Lundin Norway to discuss use of remote sensing. Lundin presented a problem they had. They had taken one million images together with Norwegian Geological Survey (NGU) using the AUV drone Hugin operated by FFI. The goal was to map large part of the seabed so the geologists could study the area better. Due to absorption of light in water, all images were bright in the middle and dark to the sides.
It meant that viewing large areas was very difficult since the overlapping images had dark and bright areas to look at. |
|
|
Mission accomplished, problem solved. |
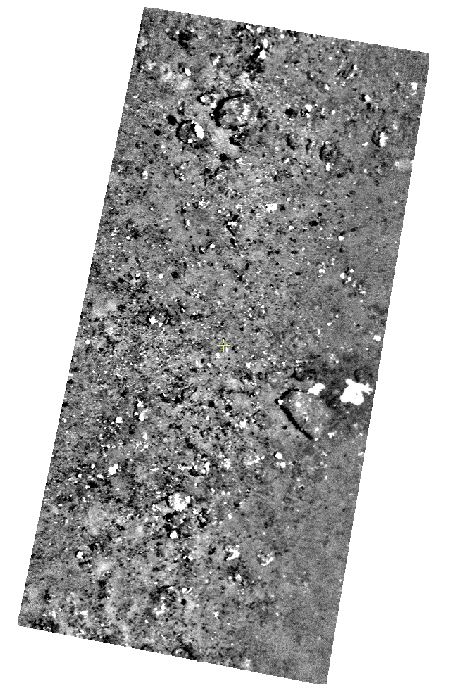
Image 164, enhanced and orthorectified.
TerraNor tried most professional image and remote sensing software in the market, but found nothing that could do the job. At the end TerraNor wrote their own software that solved the problem. In addition to enhancing the image so all parts receive equal brightness, the images were also orthorectified. This helped create ortho mosaics over large areas, see below. |
|
|
|
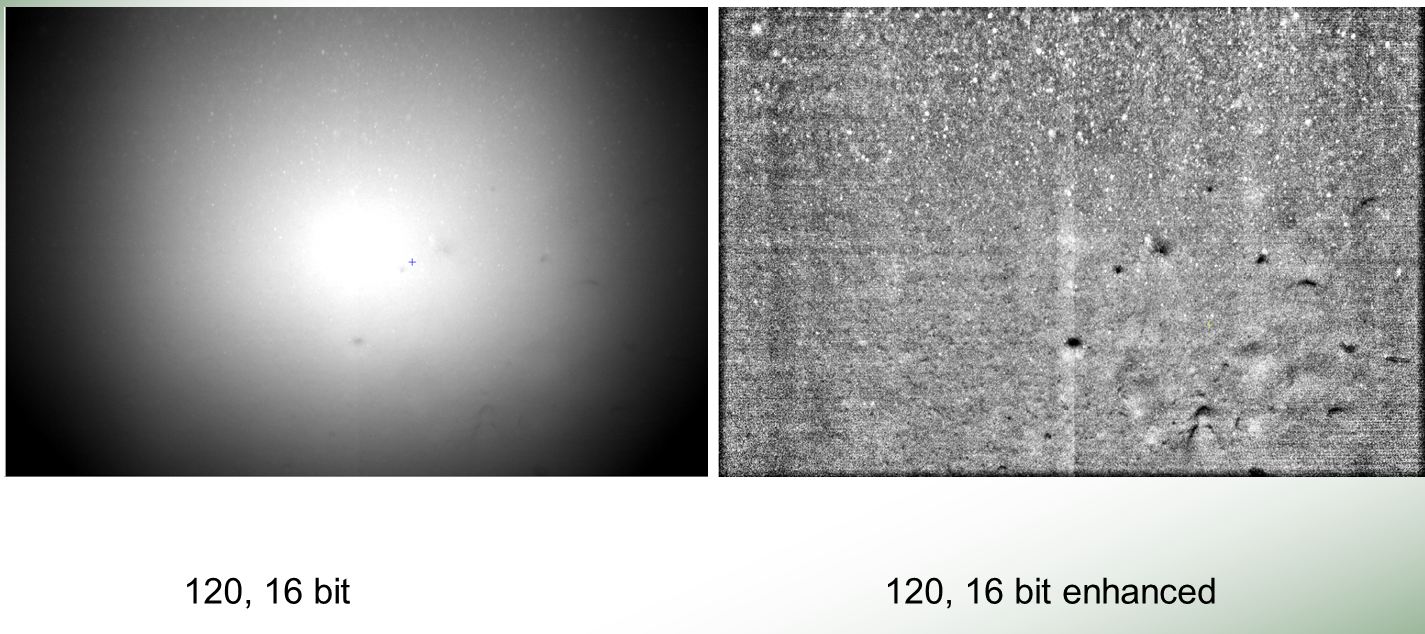
This is another example image original and enhanced. Hugin had a professional camera B/W with 16 bit data. The camera was 11 bit.
|
|
|
How to 'fly' the drone under water |
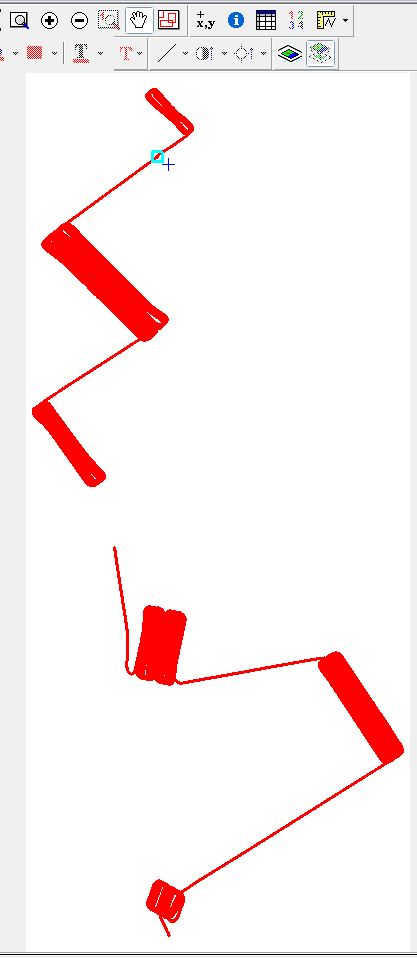 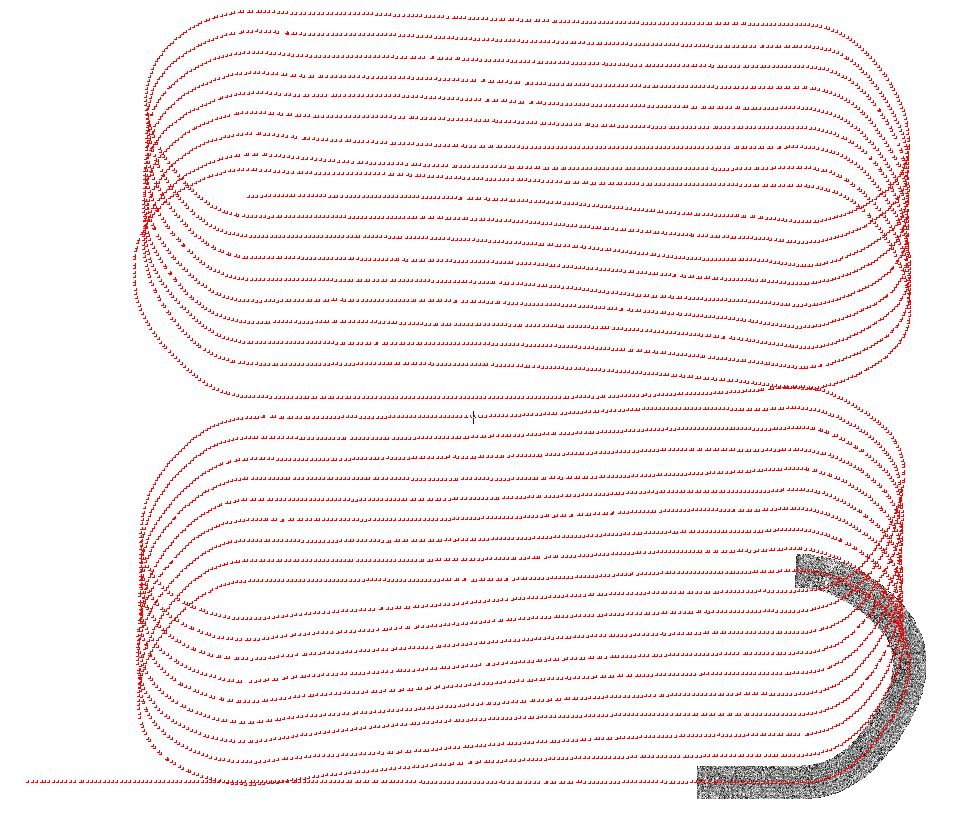
These figures shows how Hugin mapped the seabed. To the left is one mapping project, around 50 000 images. To the right shows how Hugin went in circles to cover/fill the area with images. It demonstrates the perfect navigation solution on board of Hugin. Below is a figure that shows why this is important.
|
|
|
Several mosaics viewed together |
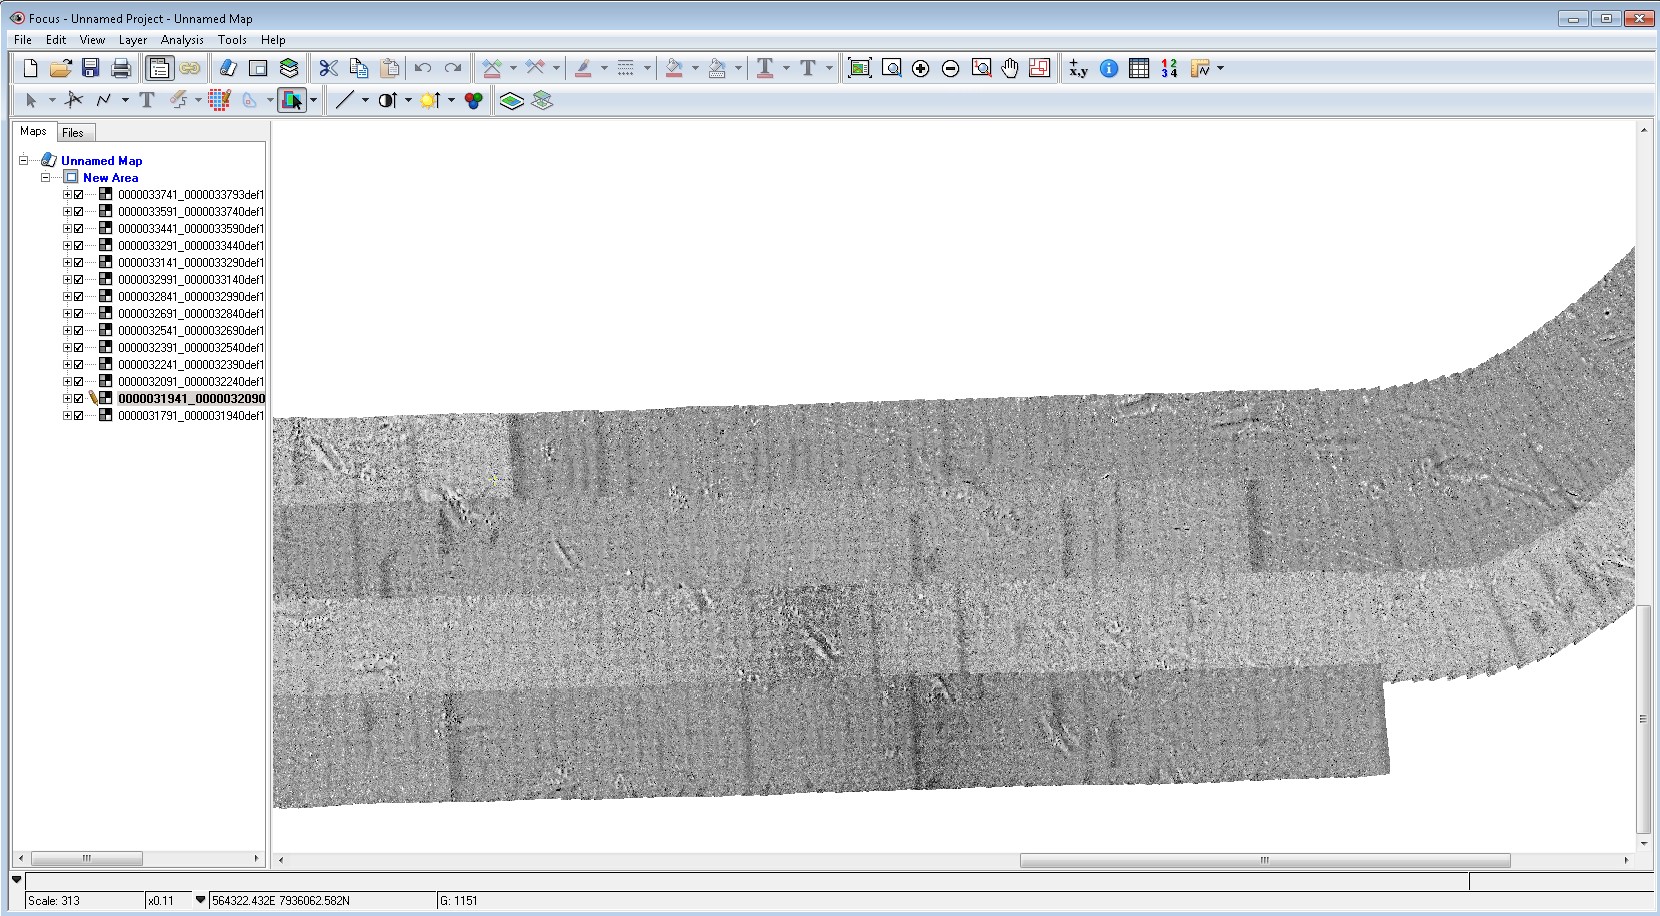
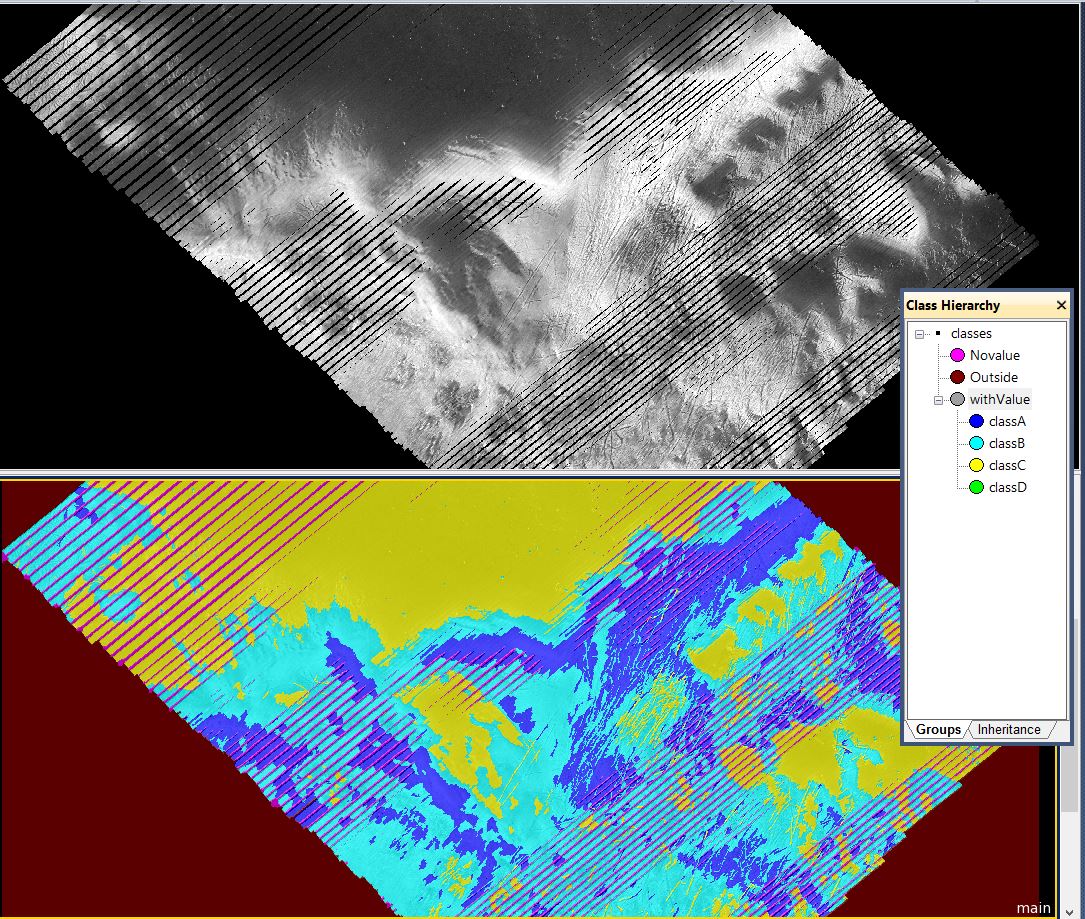
The images were mosaicked with 150 images in each mosaic. This made it easier to view the images and add/remove mosaics. The figure above shows four lines of images. A close look shows that pockmarks and plowmarks between image lines line up perfectly. Below are some more samples. As seen on the figure above, there is very little overlap in side, so matching images like one does with drones on land, is not possible. The reason for this is the cost of time and money to run the AUV. An overlap in side of 30% would probably increase the cost of 50%. For the 'big picture' it was not important for the geologists.
|
|
|
|
 |
|
|
|
 |
|
|
|
 |
|
|
|
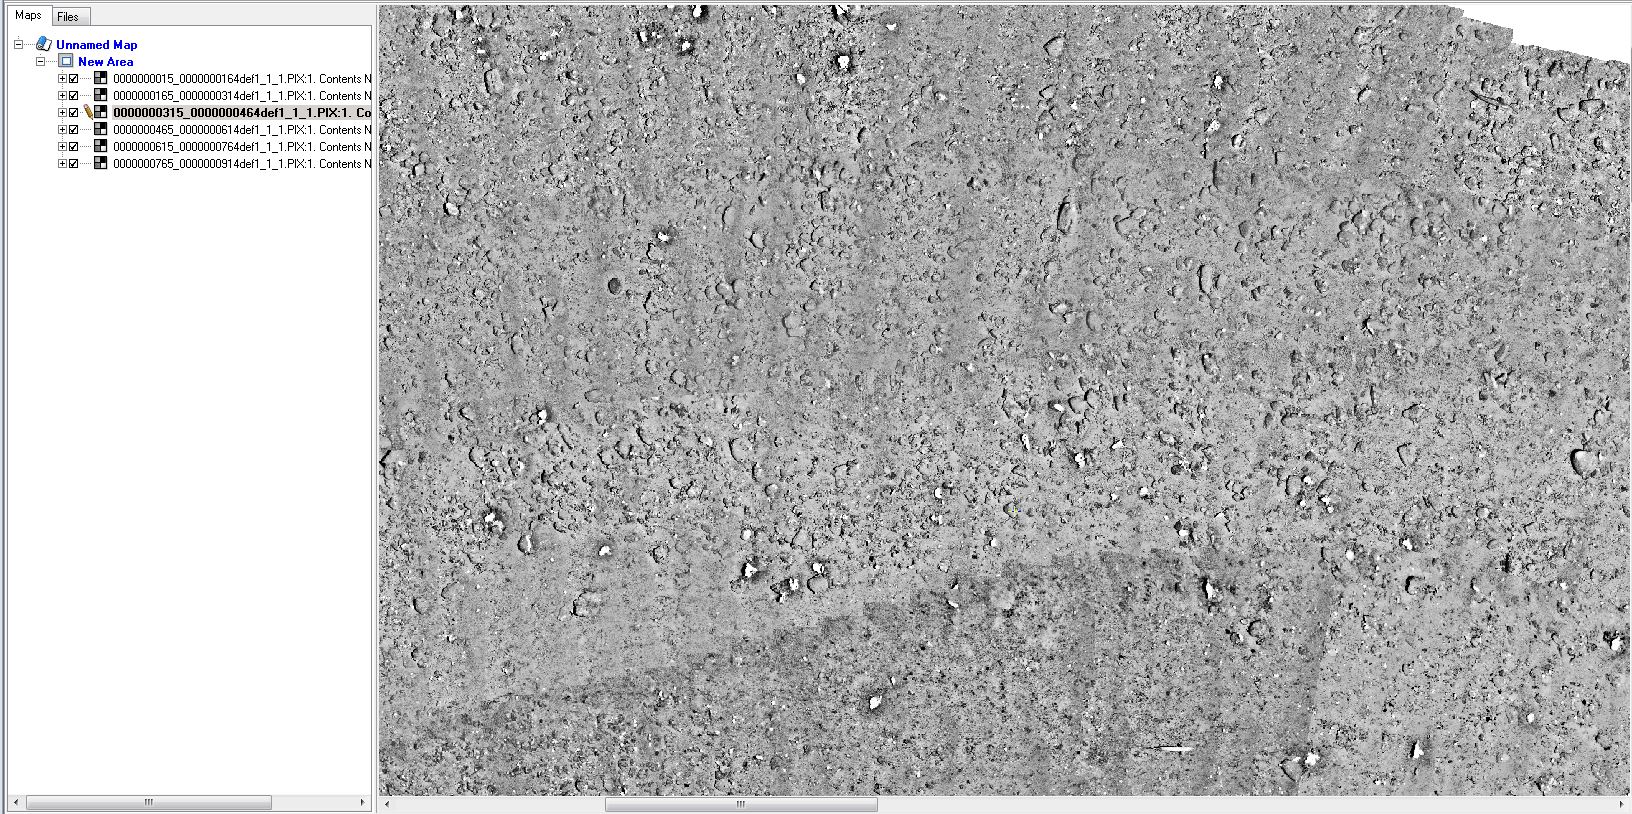
These three images shows why the geologists loved the solution. Now they can view large areas with an ortho mosaic without ruining their eyes with the unbalanced bright and dark images. |
|
|
|
|
|
|
|
Analysis of B/W images |
|
|
Second project for Lundin Norway, find fauna at the seabed |
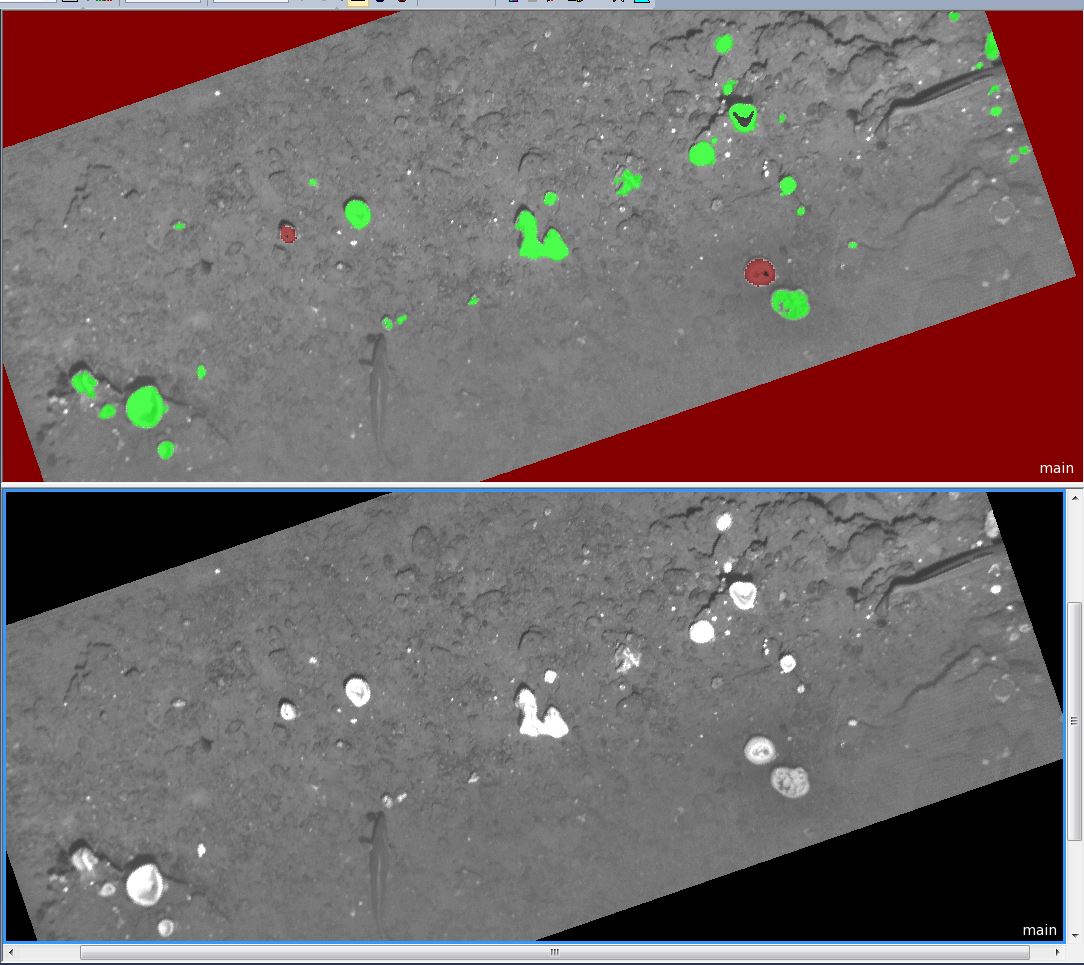
Oil companies are very careful with the environment. Lundin had a group of senior biologists to view and analyse the seabed fauna. eCognition was used to automatically detect fauna in 10 00 images. Since the images were only B/W, brightness was the key beside texture and shape. In the above image anemones and sponges were classified.
|
|
|
|
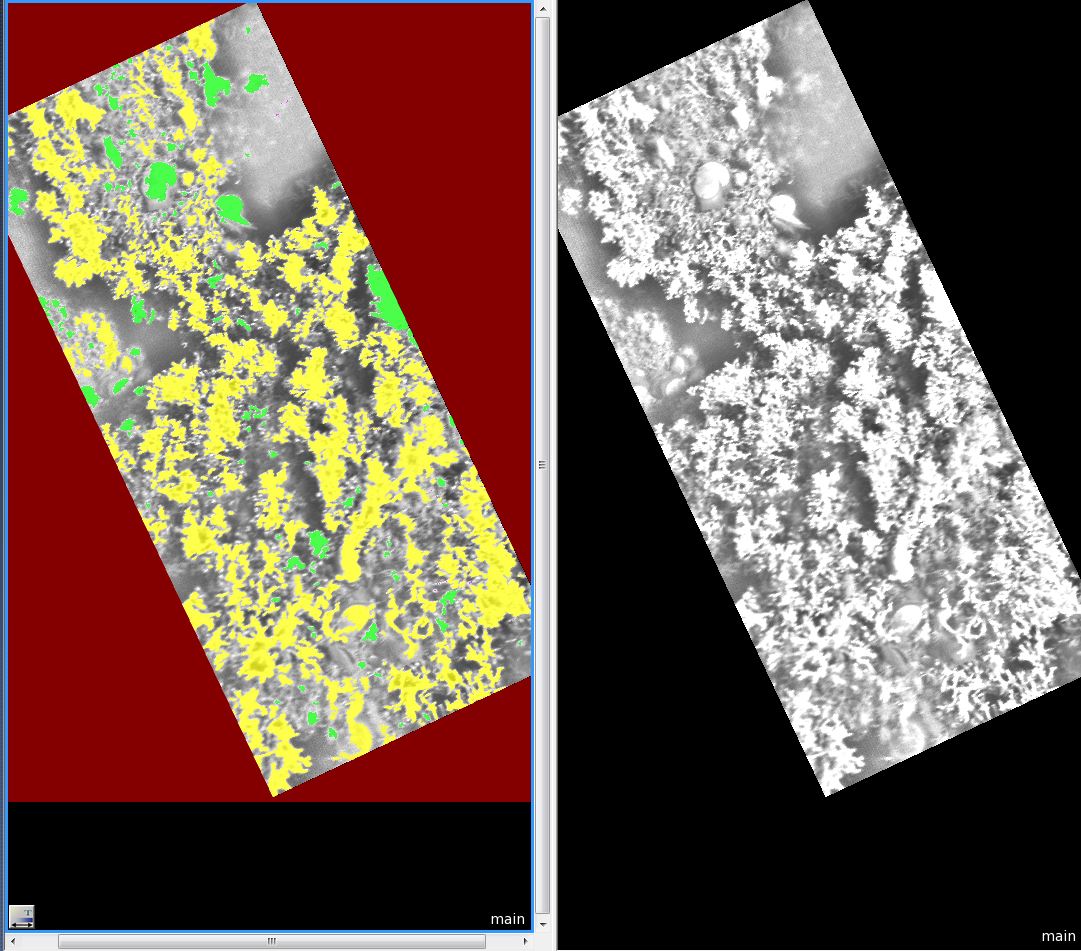
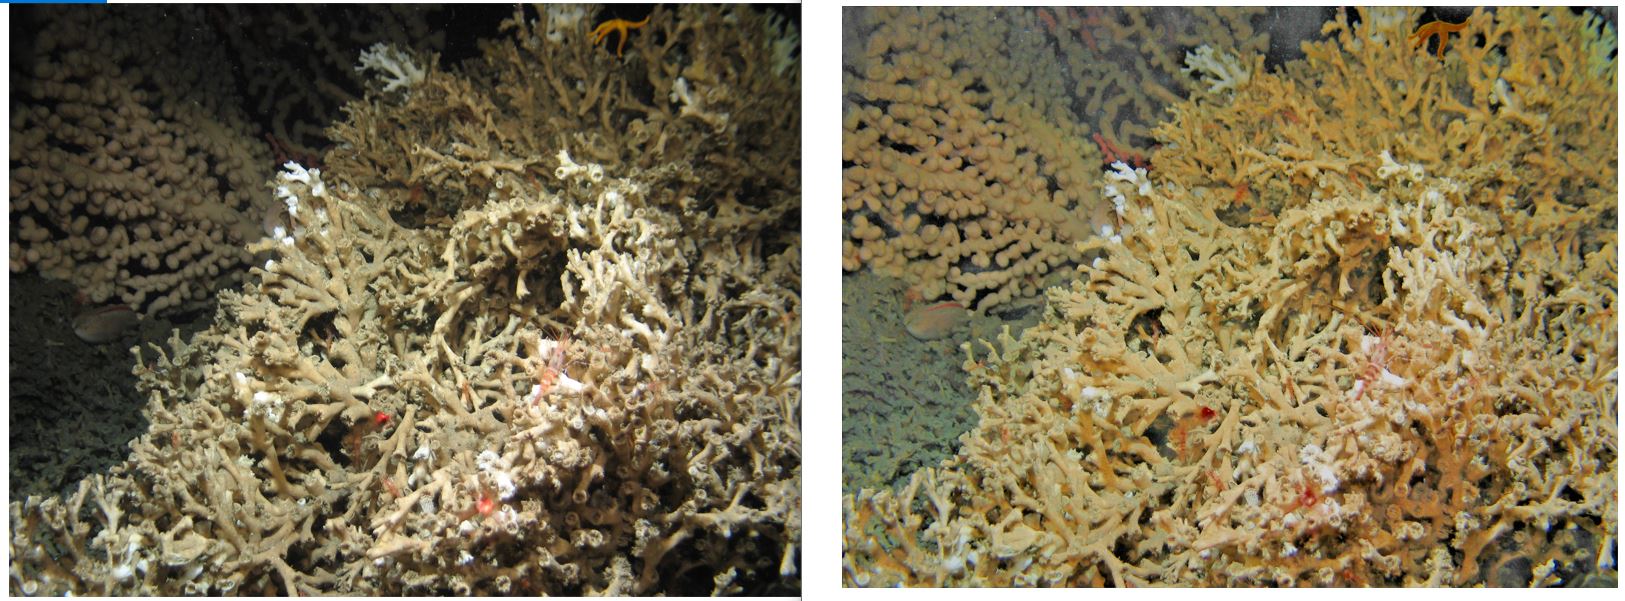
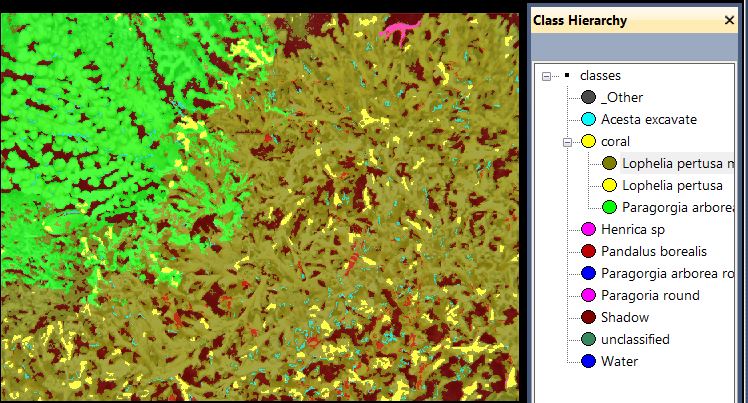
Here eCognition's function for shape is used to differentiate coral from other fauna.
|
|
|
|
The original image
|
|
|
|
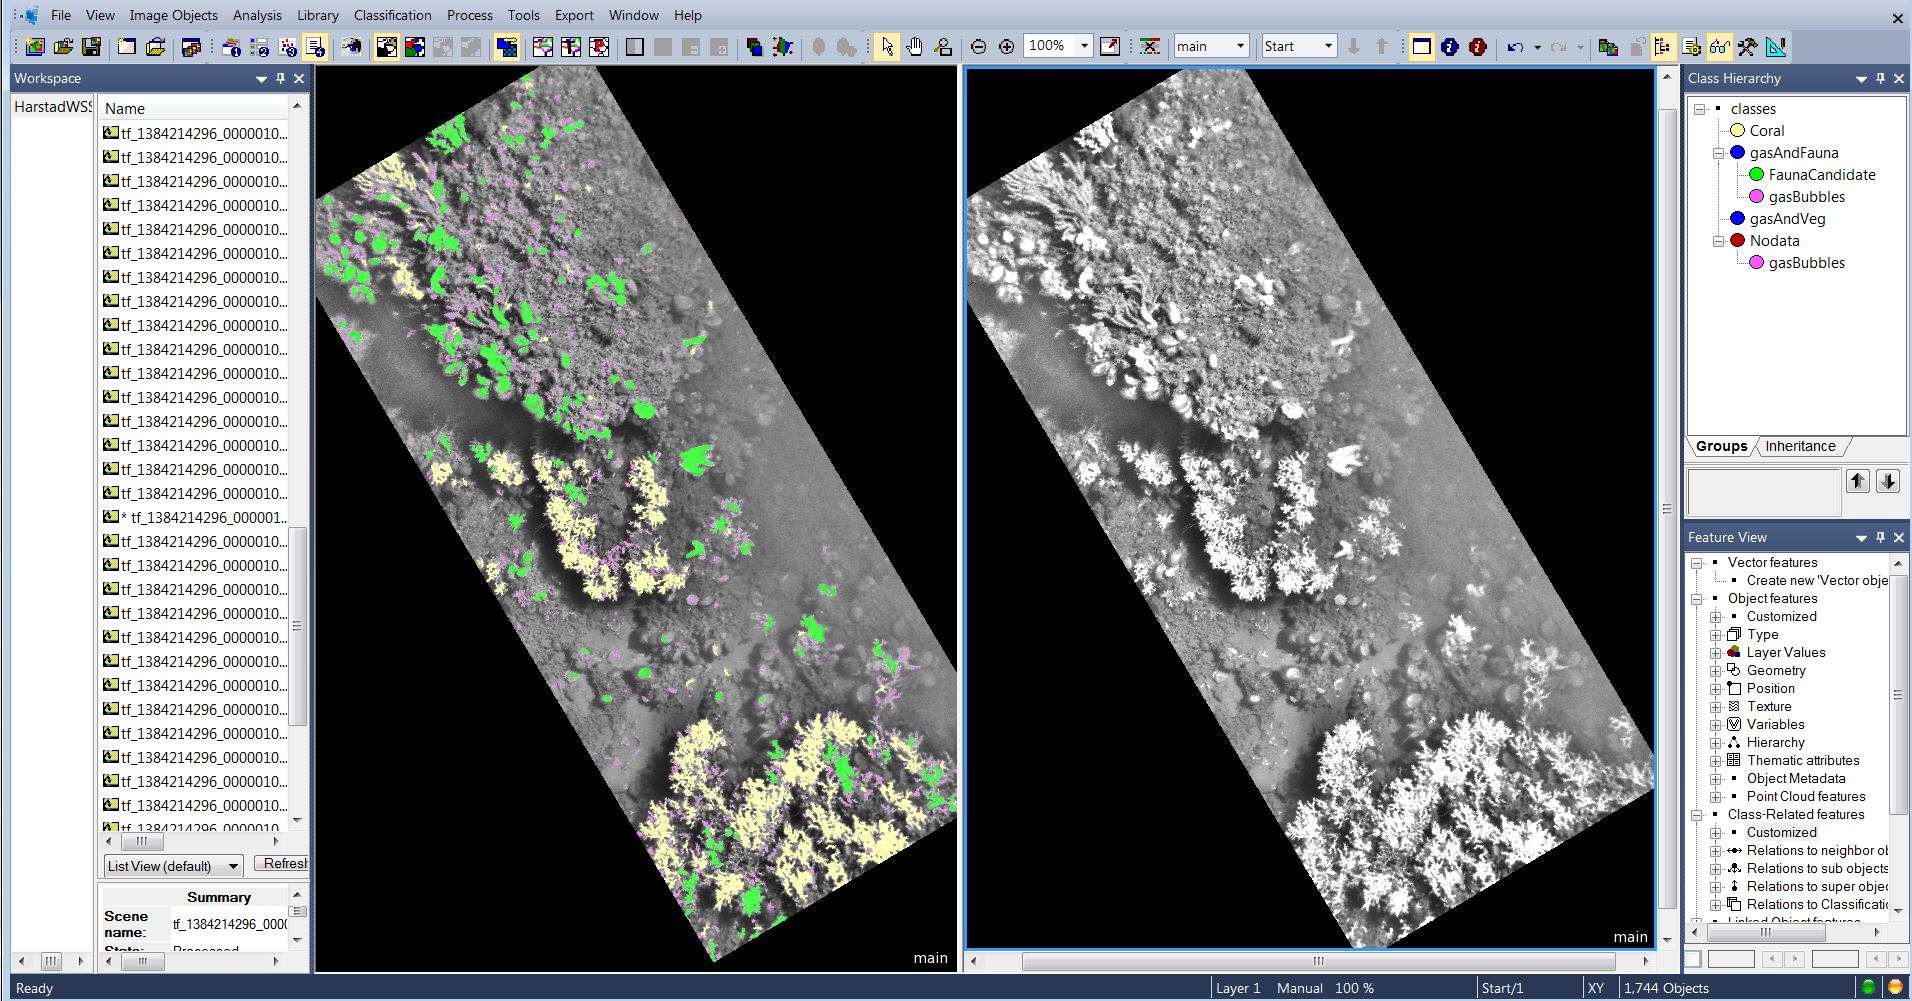
Image enhanced (colour balanced) and classified with coral and other fauna. Notice how edges that are too dark to be used, is automatically clipped away. |
|
|
|
|
|
|
|
Other examples of image enhancements |
|
|
|
|
|
|
CATHX colour images |
CATHX is a new type of camera with high quality. To the right is the original image and the enhanced to the left.anced to the left.
|
|
|
Demo project Parker Maritimect Parker Maritime |
 |
|
|
ROV images 5 meter to bottom |
 |
|
|
|
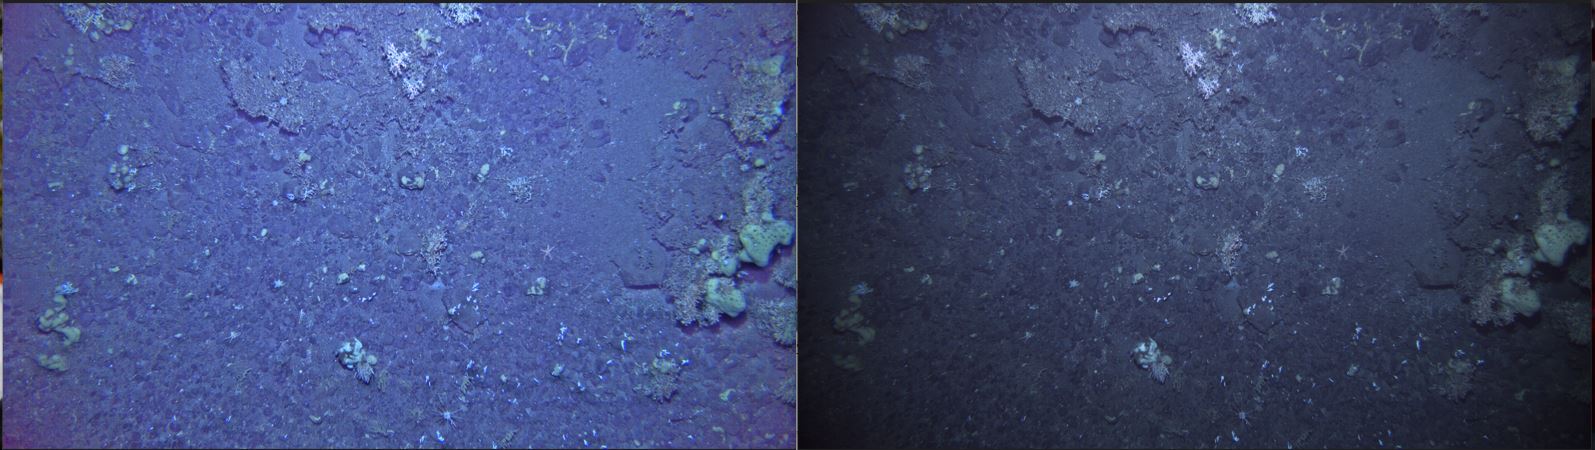
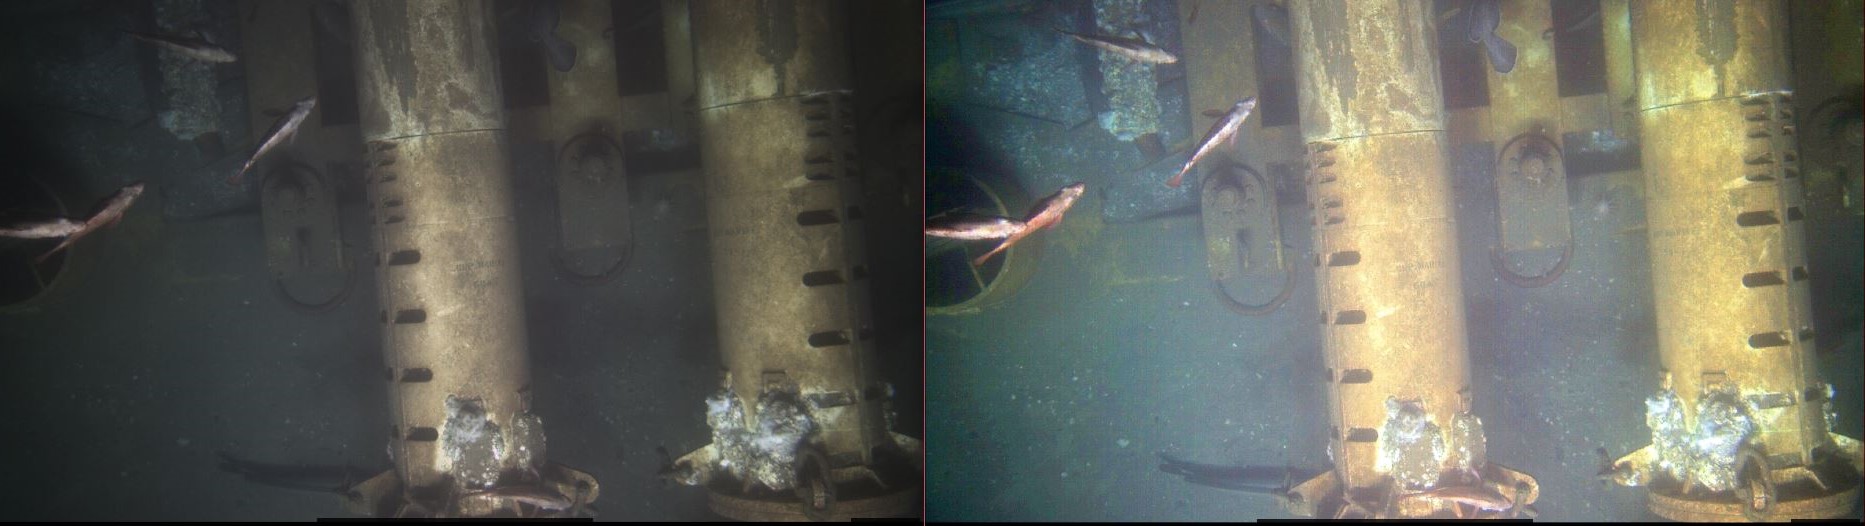
Parker Maritime is a professional survey company. This image from one ot their ROVs show how light is absorbed in water.
ROV receive power from the mother ship and can use much stronger light than with AUV. Still absorption of light is a problem.
Constructions can be 6 meter deep and equipment at the bottom is in the dark. These three images were enhanced with different end brightness. In the program it is possible define the end brightness and stretching/sharpening. |
|
|
|
|
|
|
|
|
|
|
|
|
|
|
|
Analysis geology with bathymetry and backscatterry and backscatter |
|
|
Project for Norwegian Geological Institute (NGU) based on model from British CEFAS |
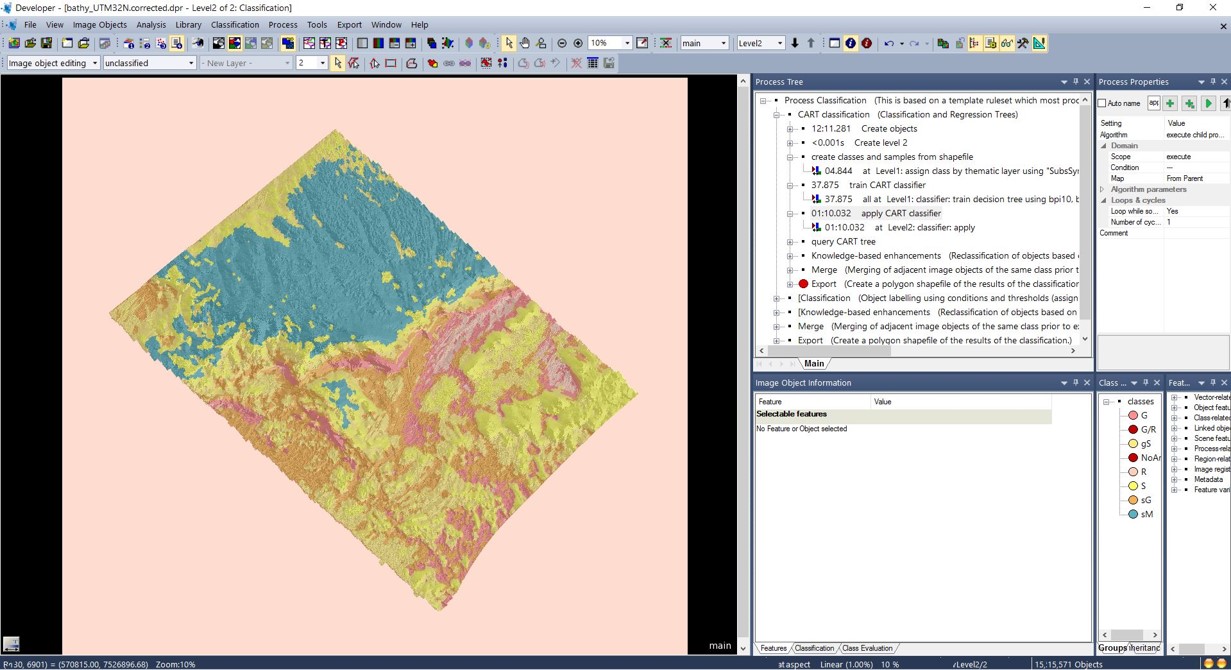
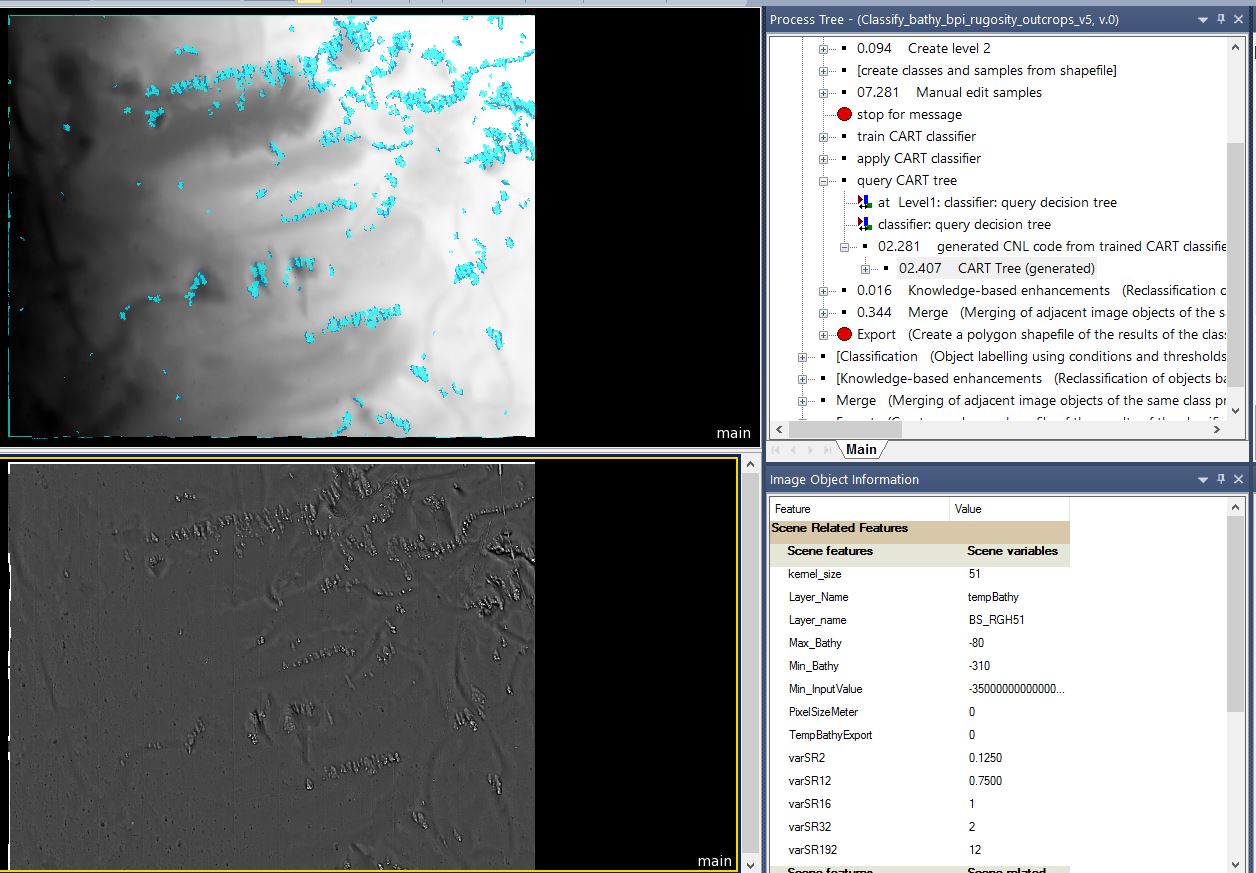
The British institute CEFAS developed a model to analyse bathymetry and back scatter to find classes of geology on the seabed. NGU refined this model and TerraNor implemented the model to be run automatically in eCognition. With bathymetry, backscatter and a sample database, processing of a geological map can be done by pressing one button. TerraNor provides this model included a 4 days training.
See the steps involved below.
|
|
|
|
 |
|
|
|
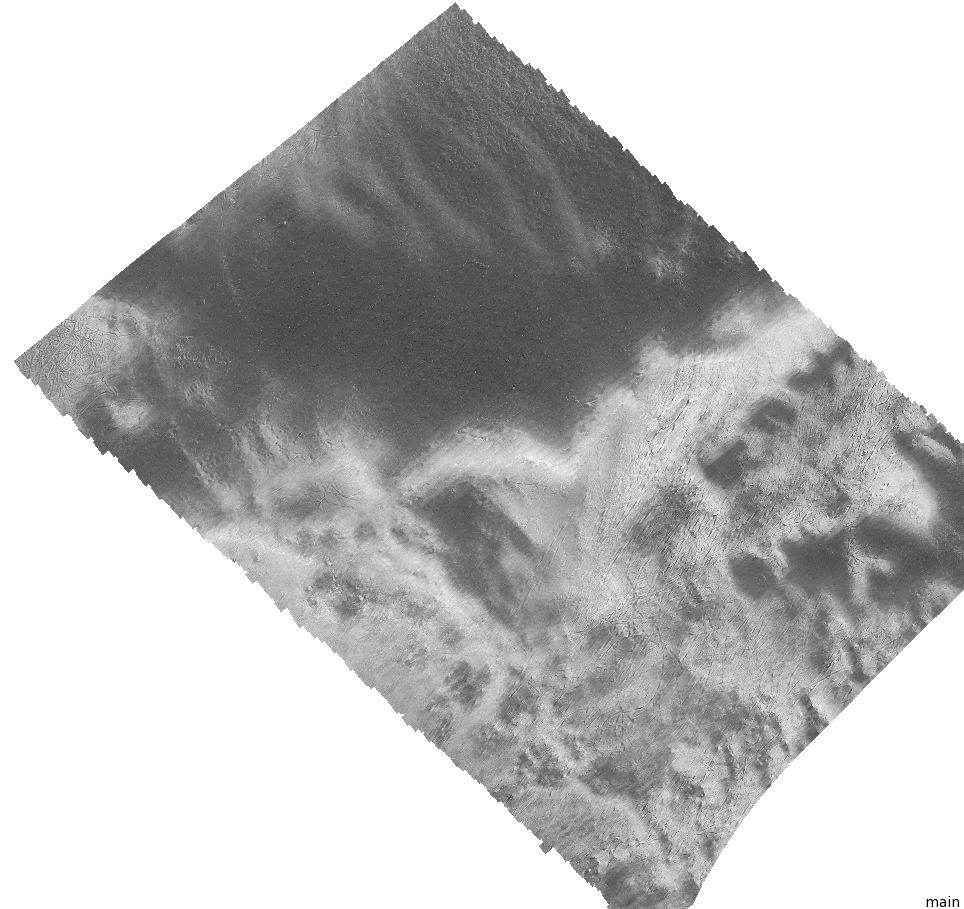
Basis for the model is bathymetry (first) and backscatter (second) datasets.
From the two datasets several derivatives are created to help in classification: Bathymetric Position Index (BPI), slope, aspect, roughness and several othe derivatives.
|
|
|
|
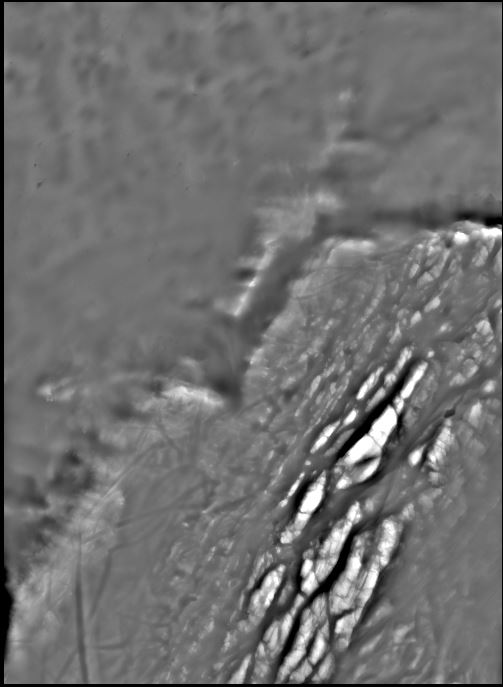
BPI 51 meter distance.
|
|
|
|
Slope based on bathymetry.
|
|
|
|
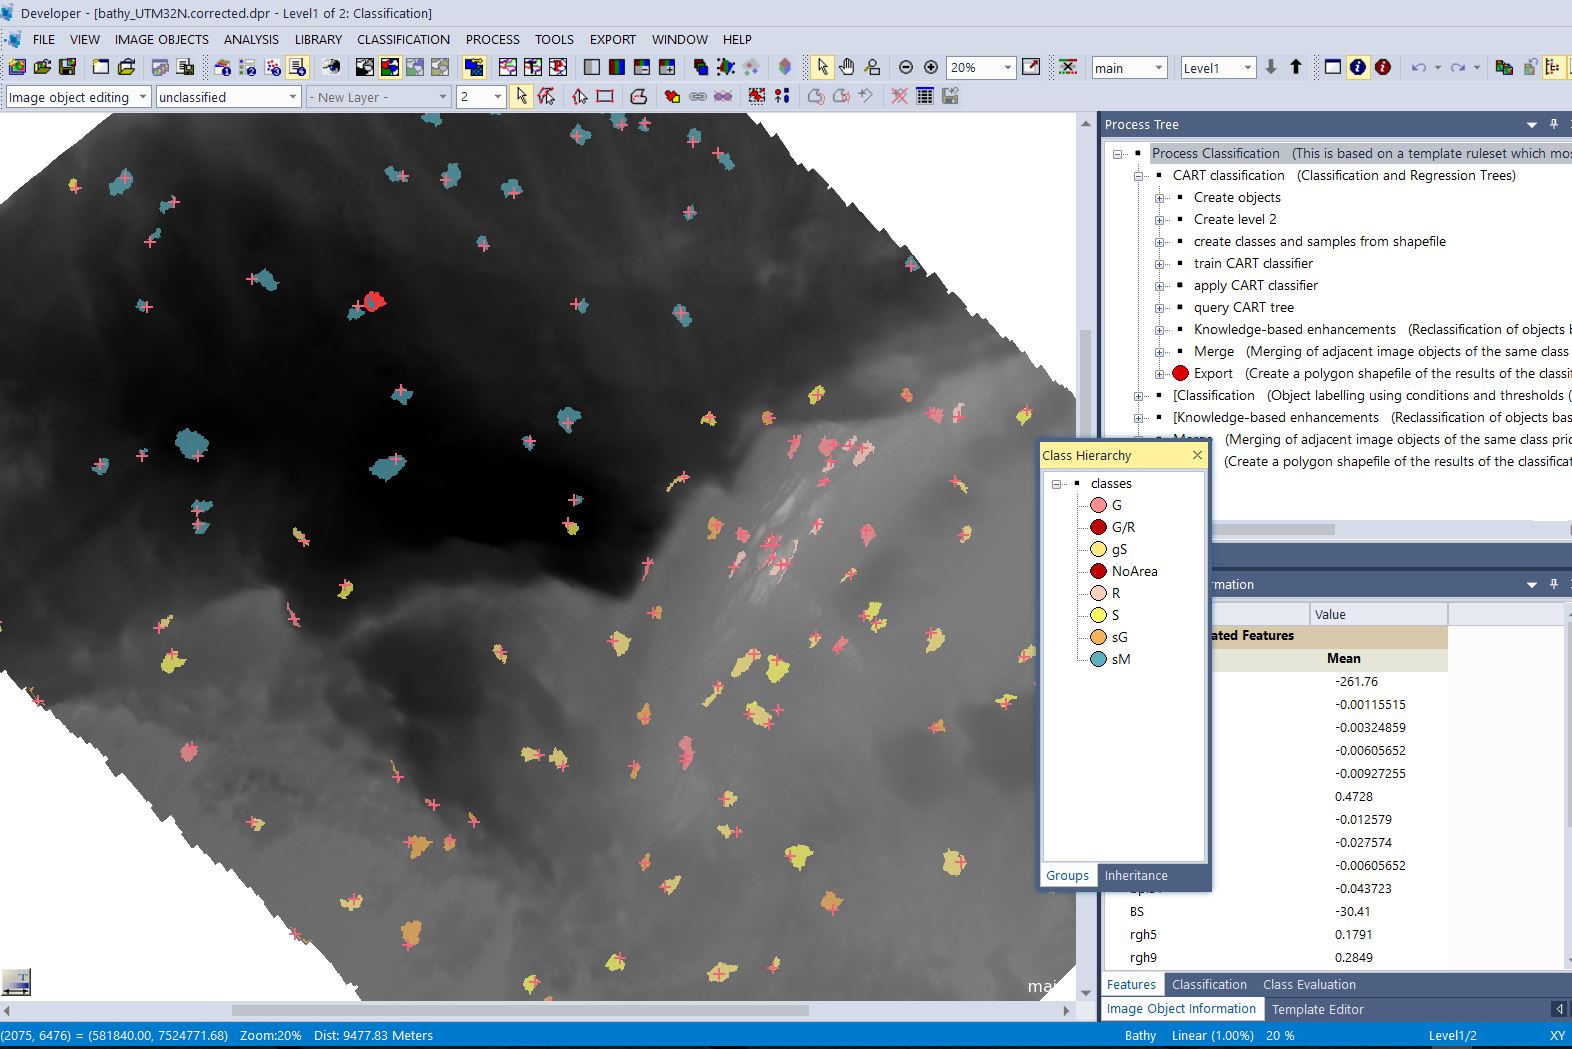
Sample points come from excavator lowered from a ship and anaysed on board.
The model is segmented in eCognition and each polygon that contains a sample point is automatically assigned to the class of the point. All polygons that are assigned a class are used as training sites for machine learning in eCognition. One of the following machine learning techniques can be used:
Bayes Bayes
Decision tree
Random trees (Decision forest)
Nearest Neighbour Nearest Neighbour
Support Vector Machine (SVM)
|
|
|
|
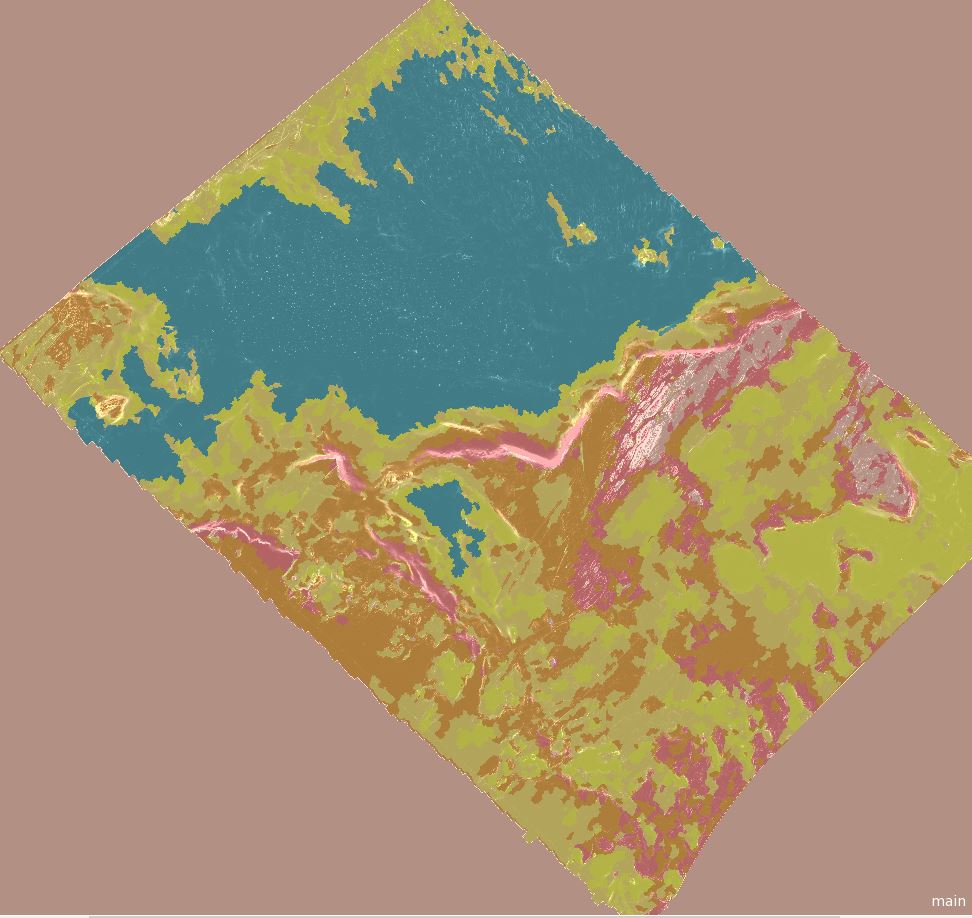
Classification done in minutes instead of weeks (the 'old' way). |
|
|
|
|
|
|
|
Remove null values under ship values under ship |
|
|
Project for NGU to remove null values under the ship. |
The way sonar works, data straight under the ship will have no value. eCognition was used to automatically fill the areas with null data with data from the side polygons. This shows the strengths of eCognition with features to manipulate and correct data before and after classification. First step is segmentation and classification in correct classes based on machine learning
Below are the steps used to remove the null areas under the ship.
|
|
|
|
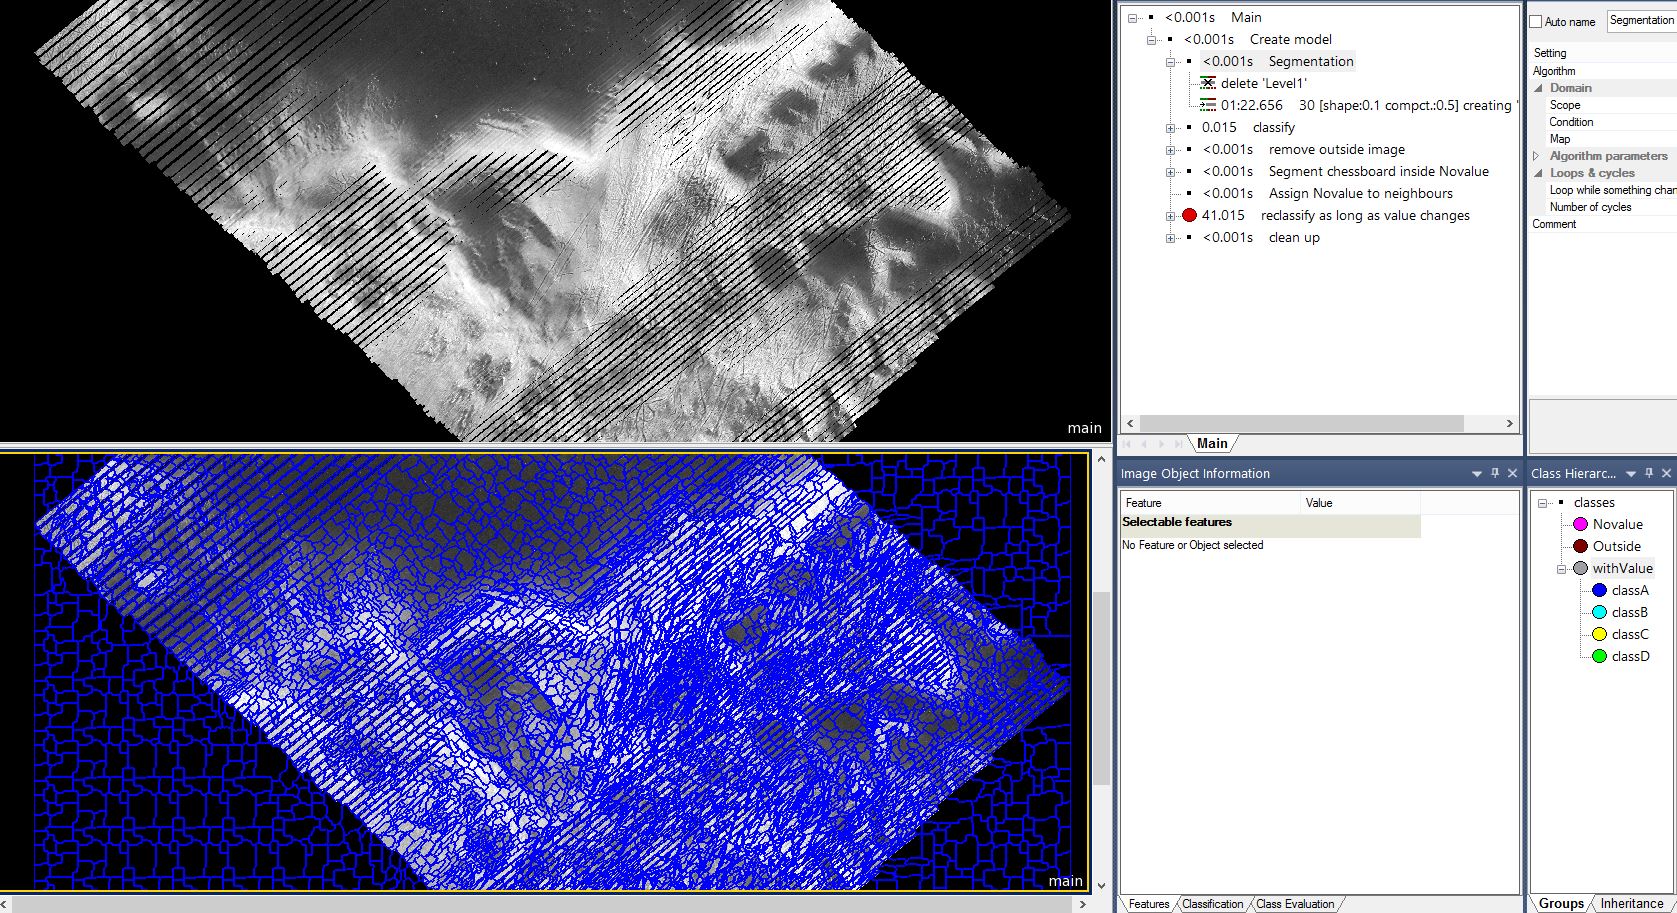
First step is to classify null values inside image and remove the outside area.
|
|
|
|
Detailed view of null areas to be corrected.
|
|
|
Problem solved, null areas classifiedl areas classified |
eCognition has a function to grow objects that is used to fill the null vaues with classification from the objects on each side. This does not give a 100% correct result but is 'good enough'.
In all classification there will be errors. The difference between a very good result and a perfect result is often too costly. |
|
|
|
|
|
|
|
Finding UXO on the seabed |
|
|
Project for NGU, find UXO objects |
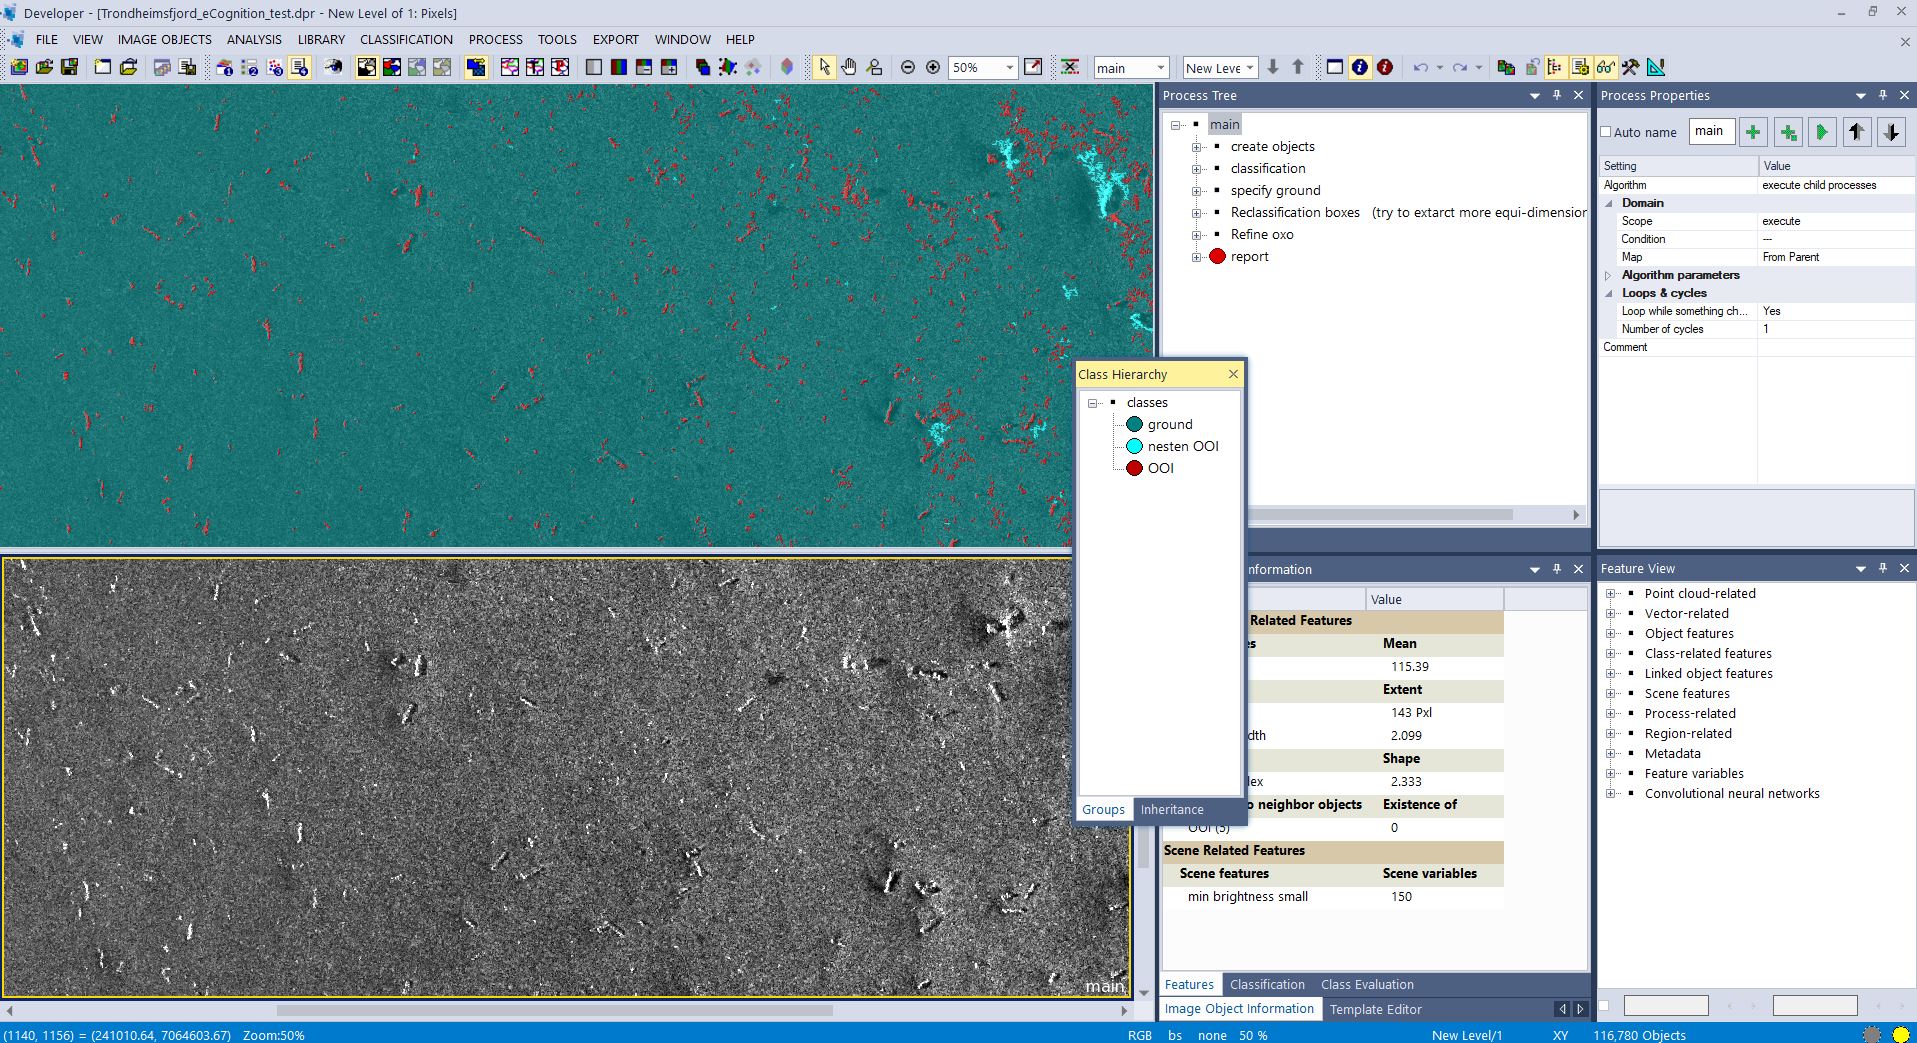
After world war II lots of unused ammunition were dumped in the ocean and fiords. This was the old thinking. Today we know better and will (hopefully) not do such a thing. It turns out that ammunition from WW II is still very dangerous and can explode 80 years later. eCognition was used to classify sonar data where backscatter was the important feature. Ammunition has normally metal around and give a high return signal in backscatter. Features in eCognition like shape and size was used to distinguish ammunition (UXO) from other metal. Statistically the result is not perfect. In this area the amount of UXO was large and this method gave a good map of where the UXO were on the seabed.
|
|
|
|
|
|
|
|
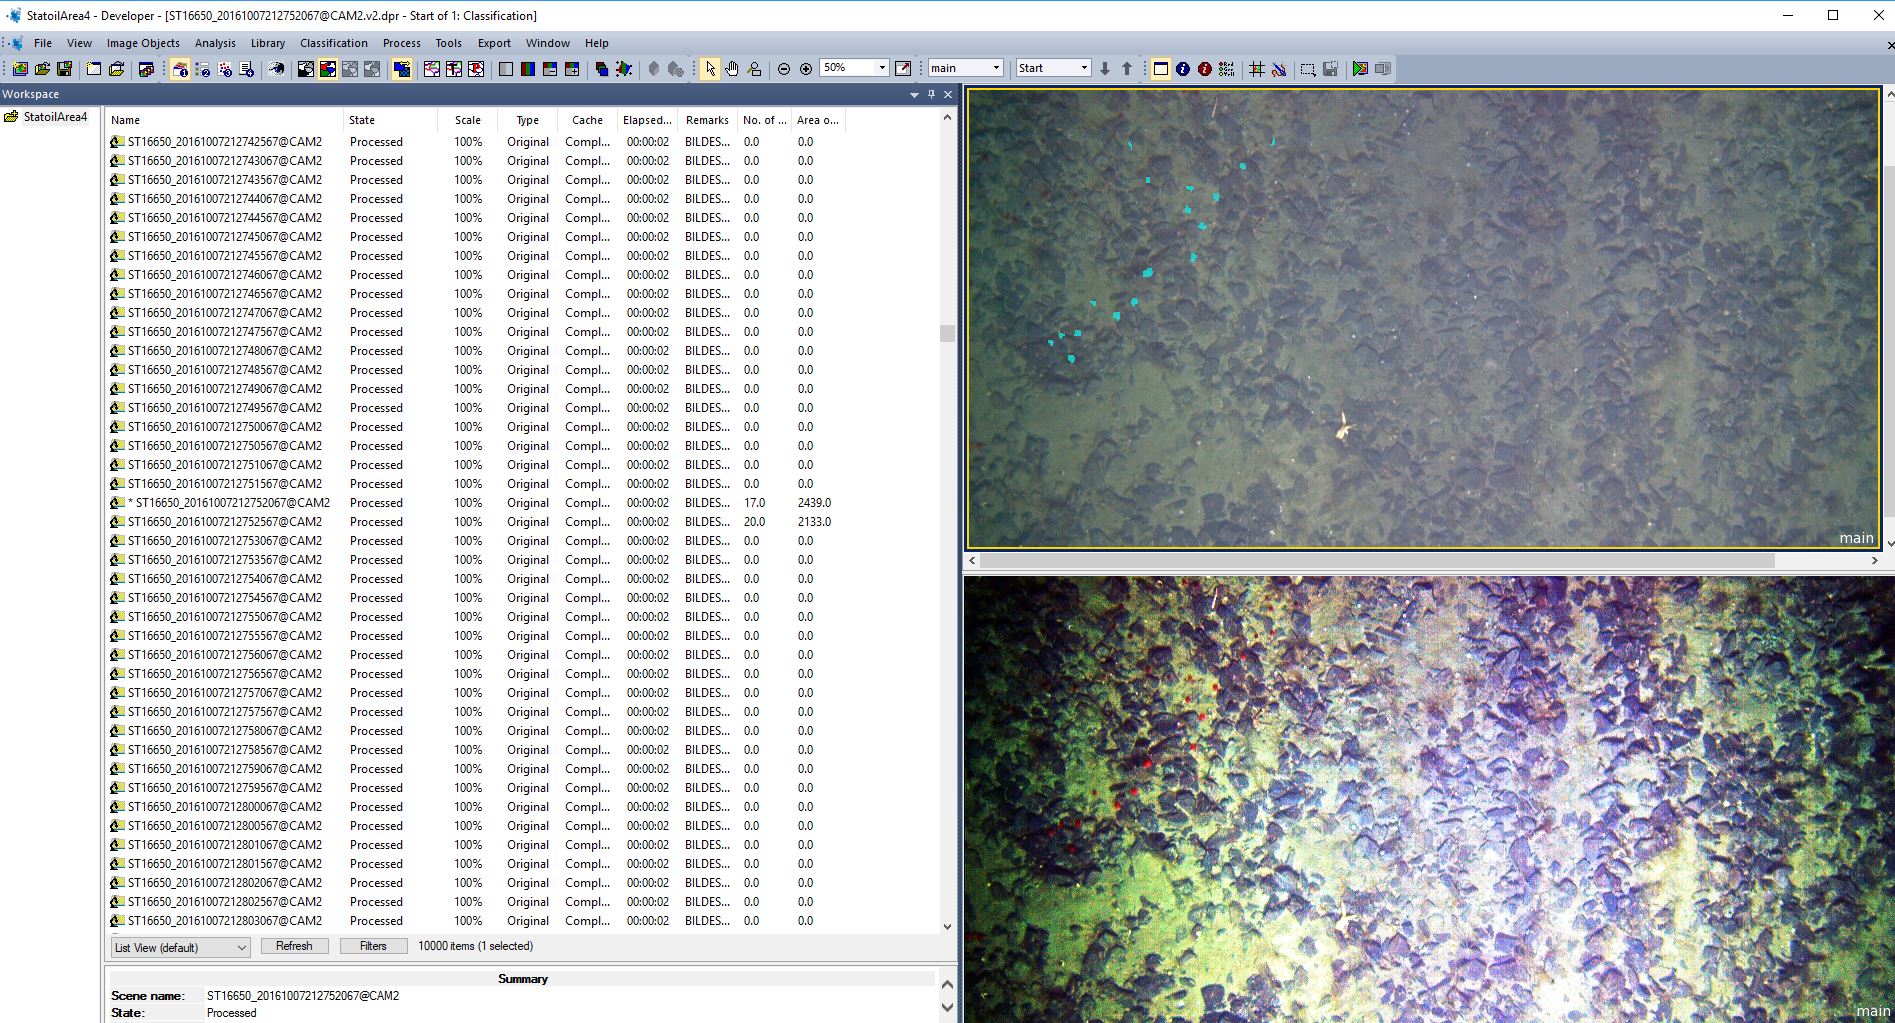
Still camera from Statoil/Equinor |
|
|
Public camera |
 |
|
|
|
These two images are from a still camera that takes pictures continously. The original image to the left and the enhanced image to the right. All images used to be public available in both 16 bit and 8 bit format.
|
|
|
|
|
|
|
|
|
|
|
|
|
|
|
|
Analysis plowmarks and pockmarks |
|
|
Project for NGI |
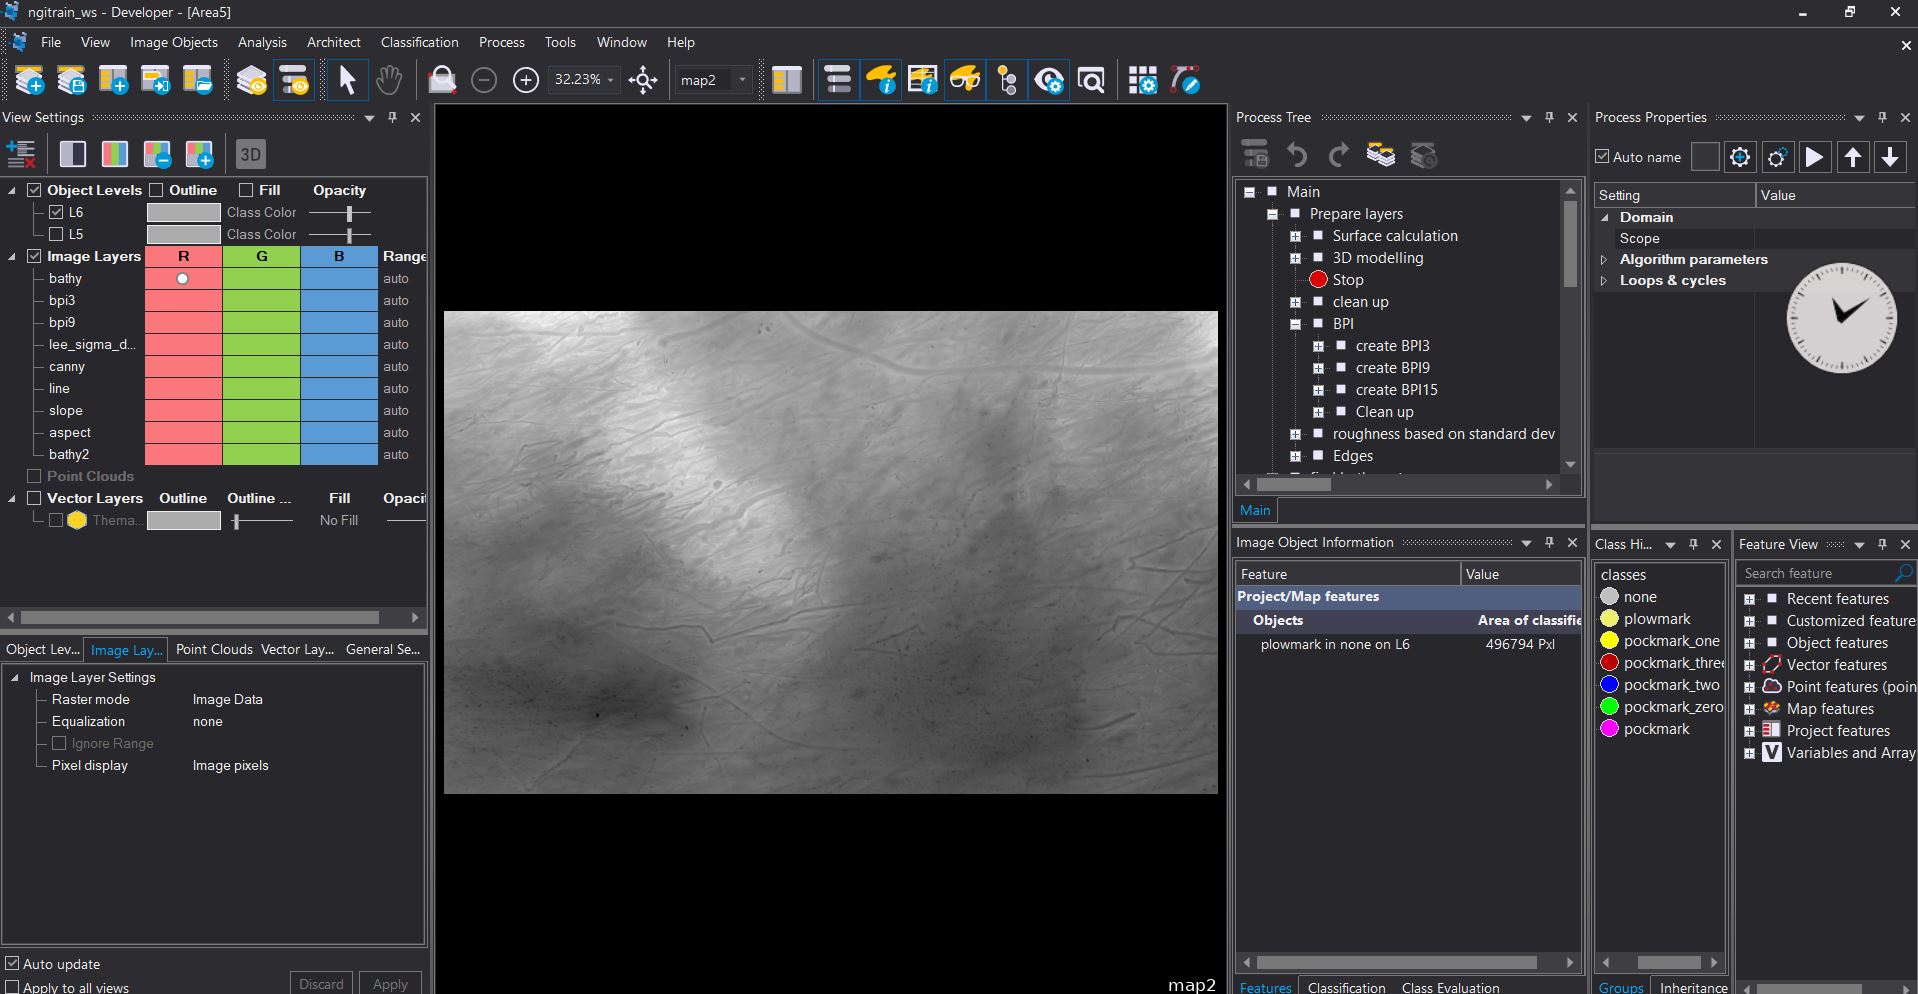
This project shows how to use eCognition to analyse bathymetry for a large area on the seabed.
|
|
|
|
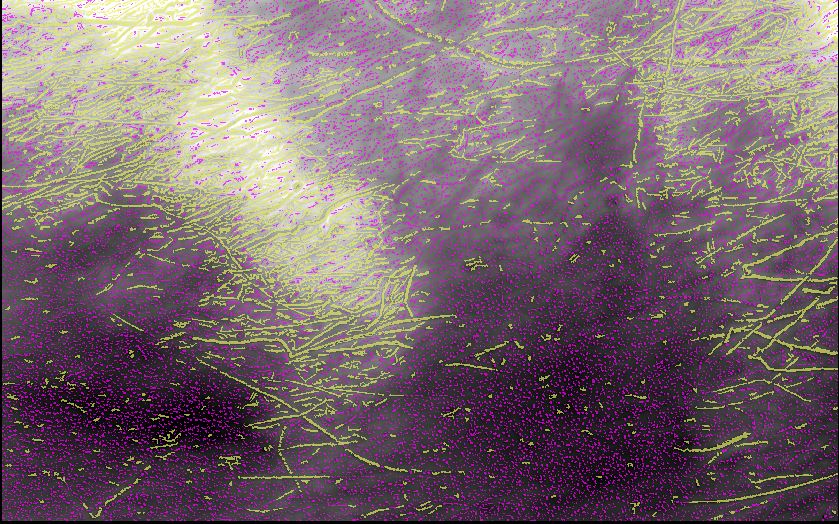
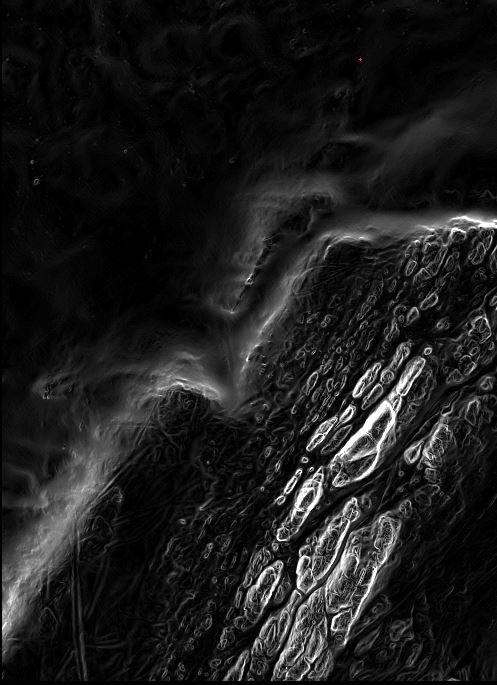
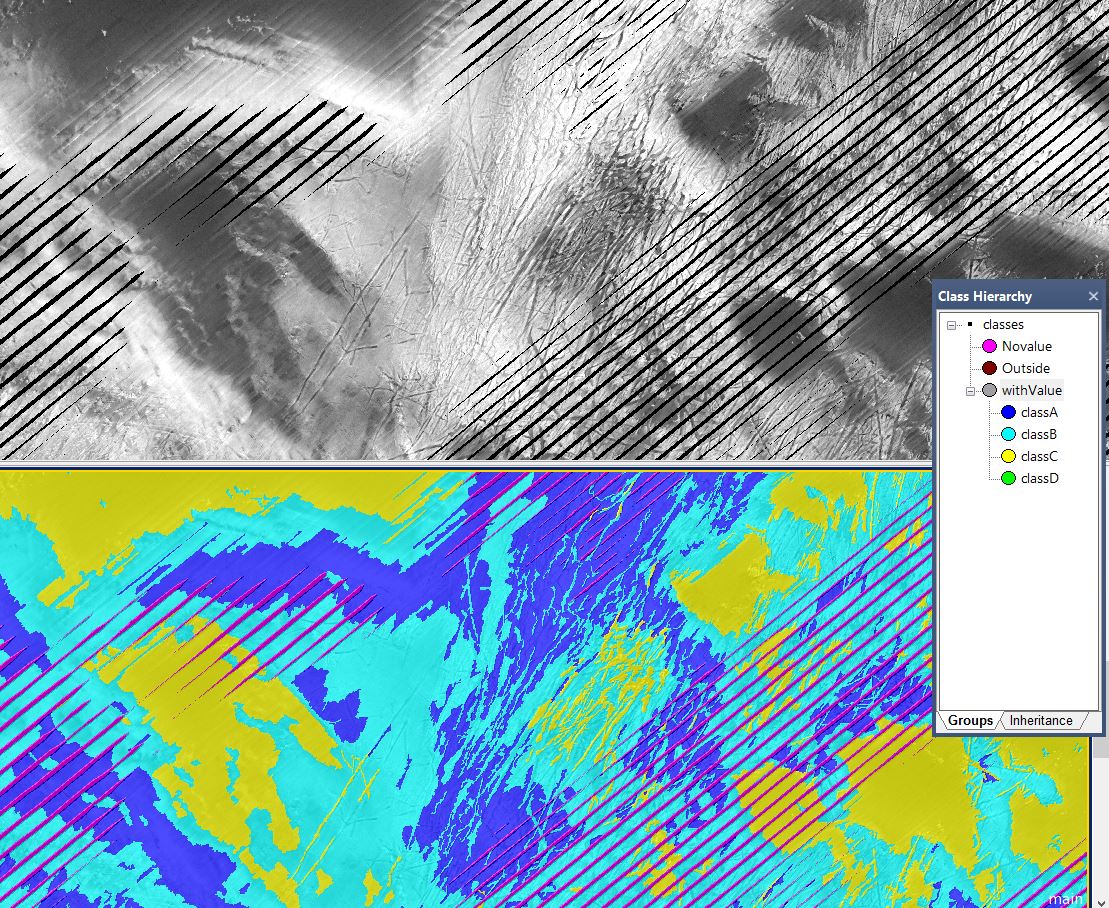
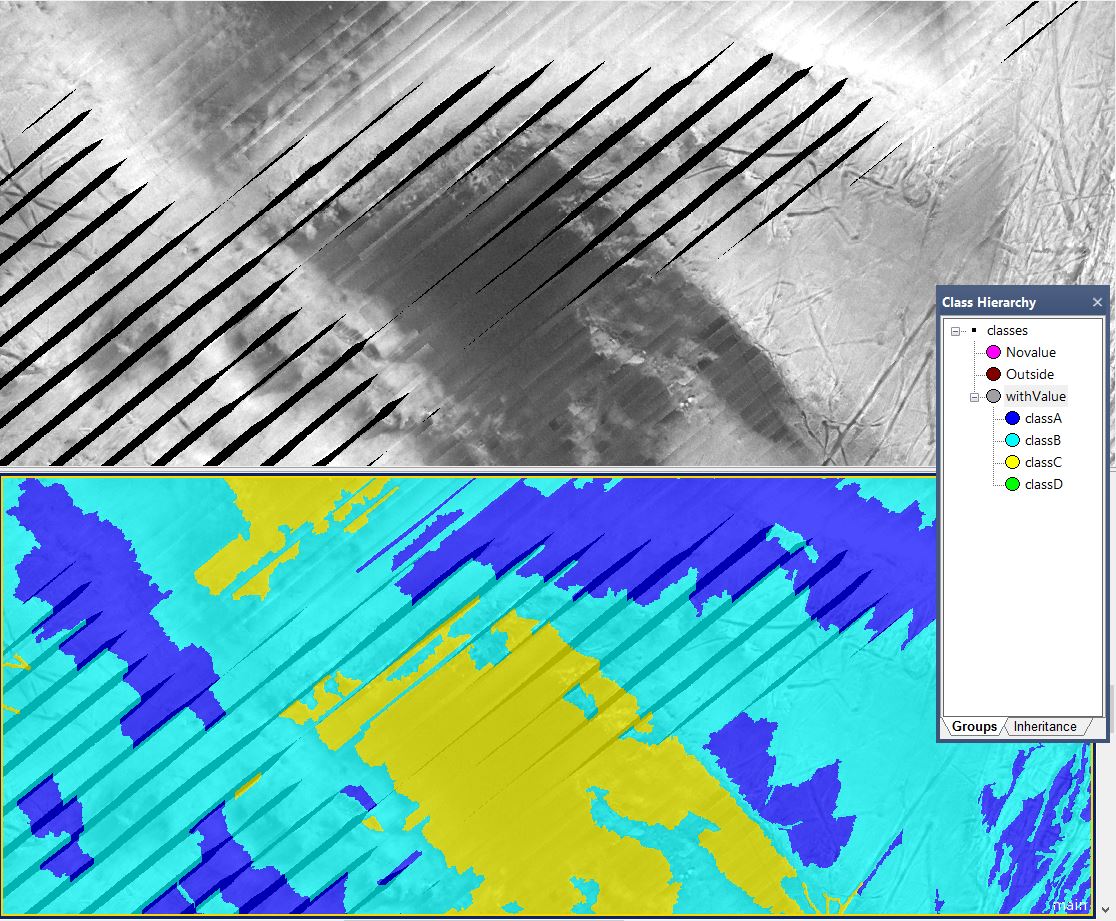
How to use BPI/TPI (Bathymetric/Terrain Position Index) to analyse pockmarks and plowmarks. This shows the result. Plowmarks in yellow and pockmarks in pink.
|
|
|
|
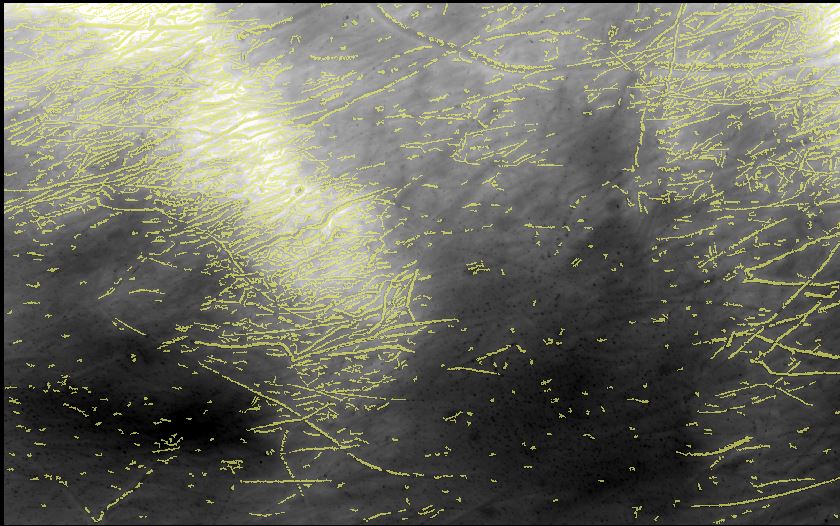
Plowmarks long and narrow.
|
|
|
|
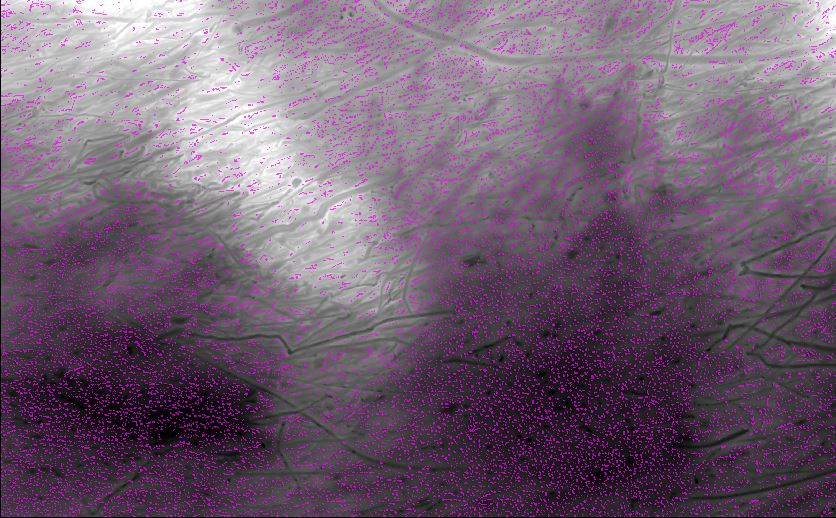
Pockmarks small and round.
|
|
|
|
Pockmarks based on depth.ks based on depth. |
|
|
|
|
|
|
|
|
|
|
|
|
|
|
|
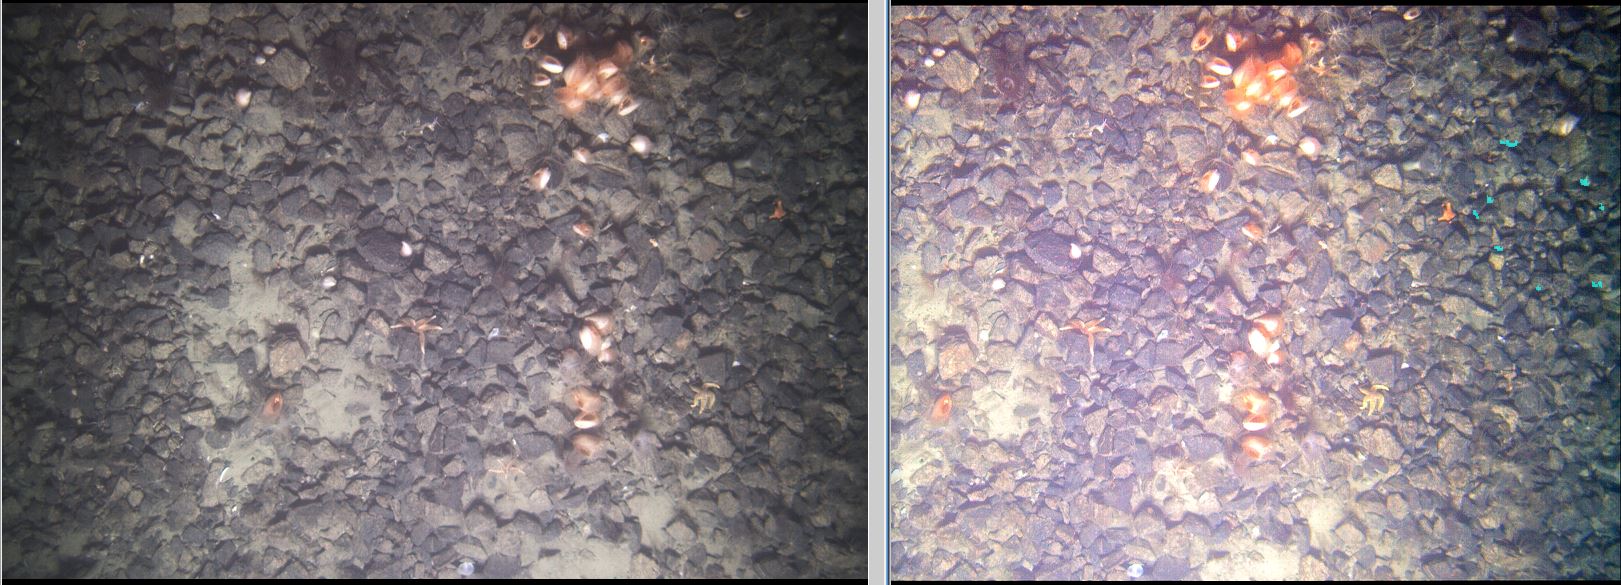
Classification of fauna with use of ROV images |
|
|
Demo Project for Gardline |
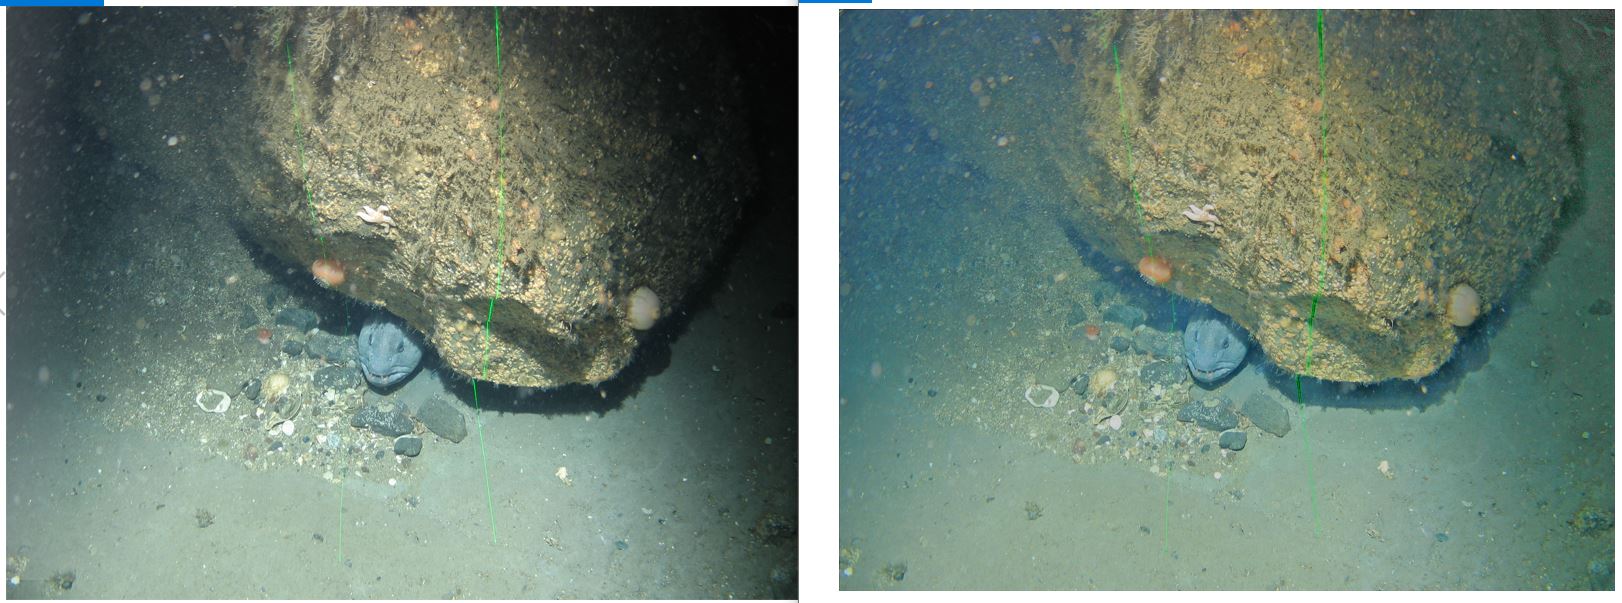
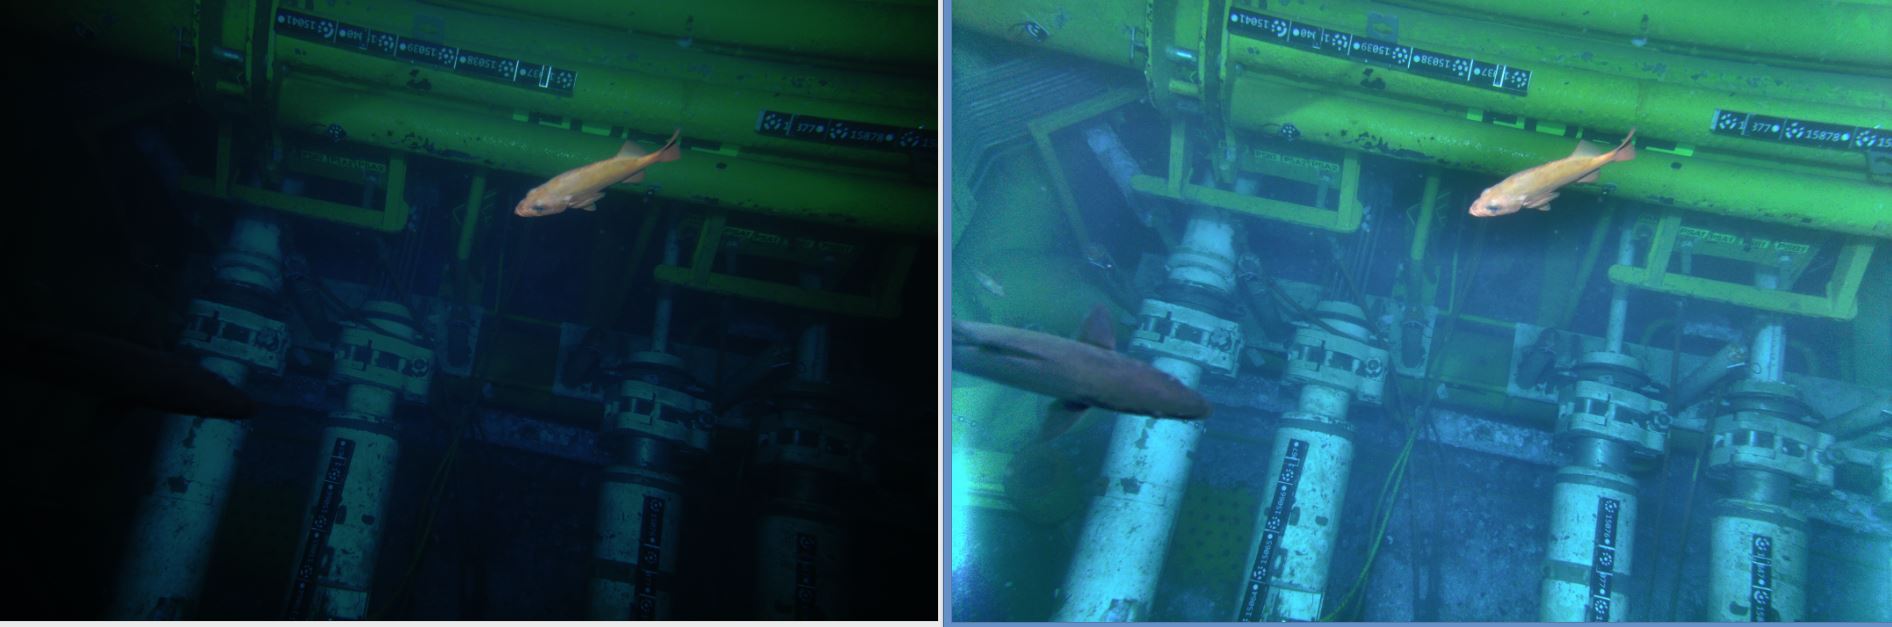
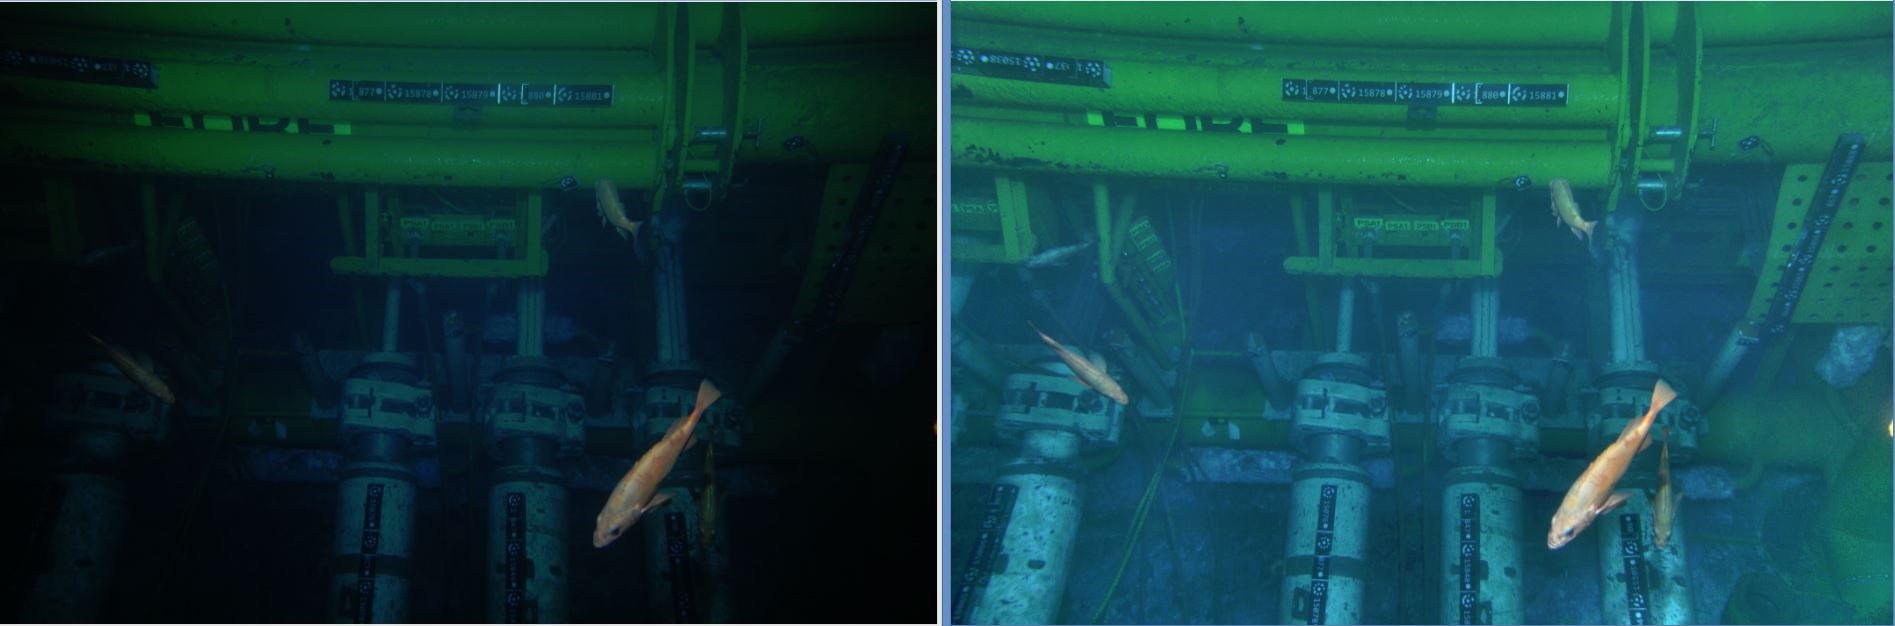
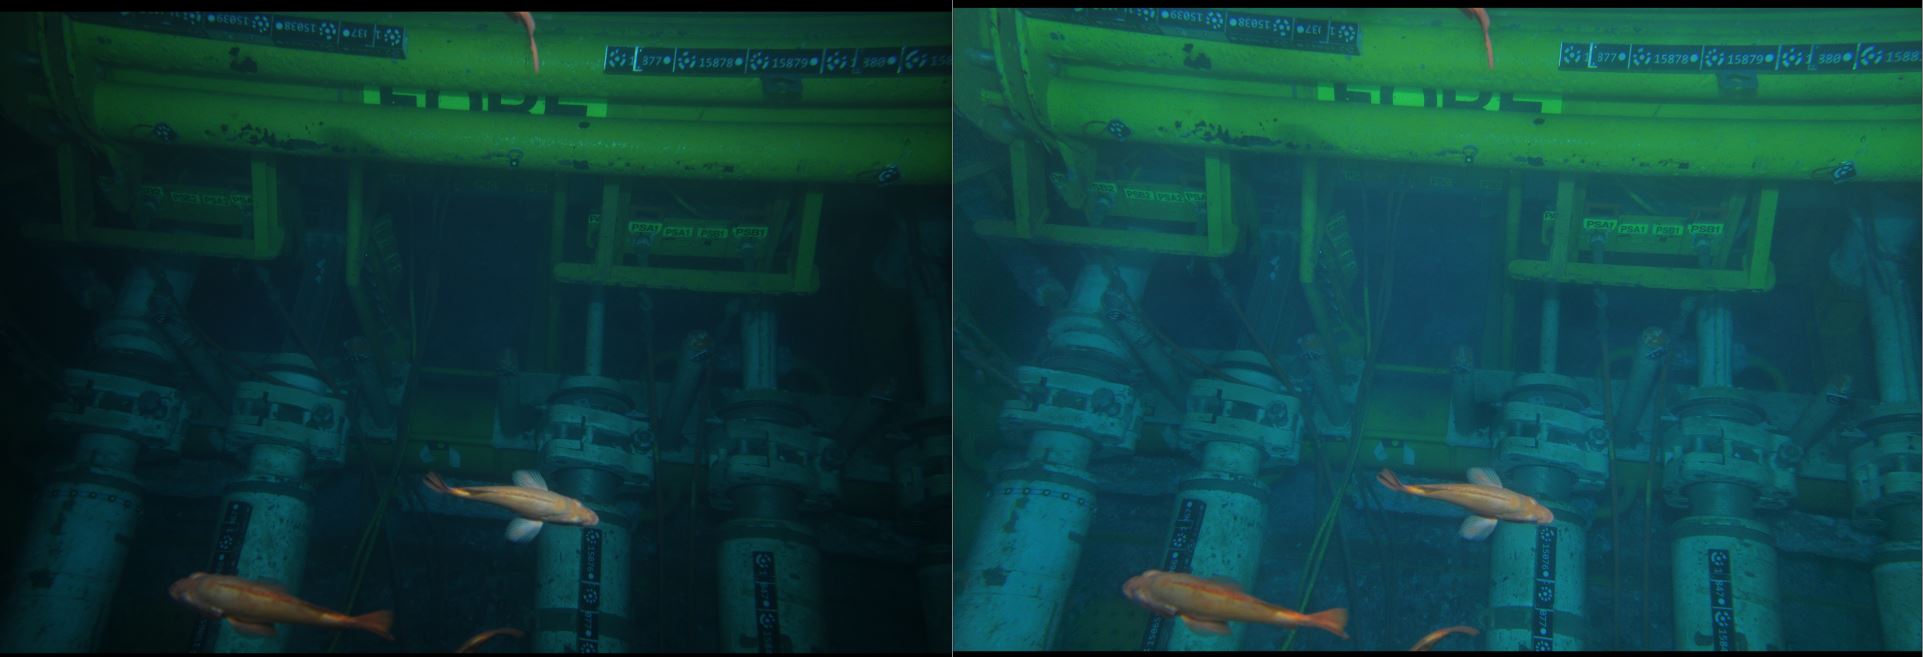
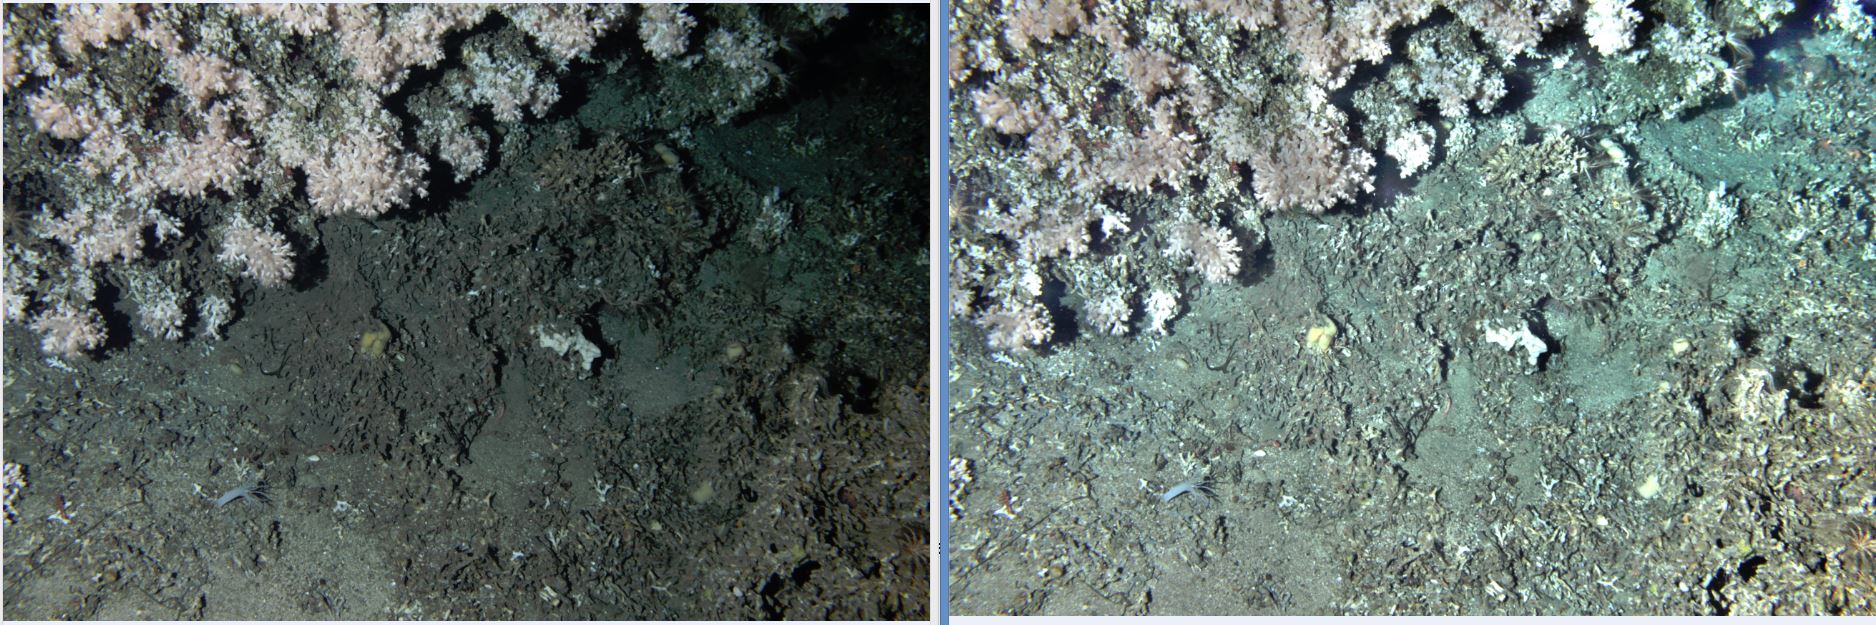
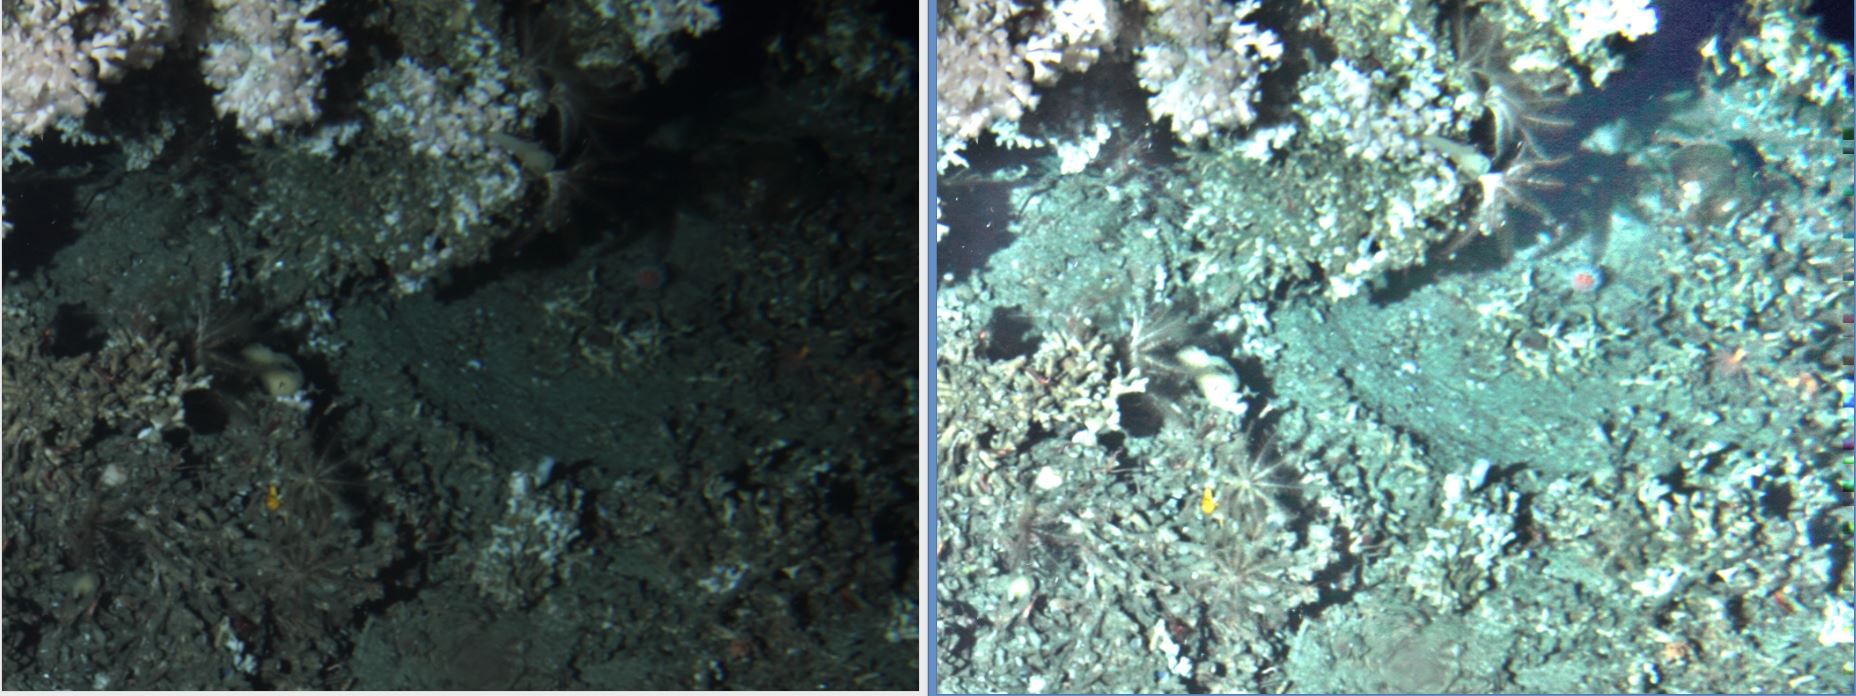
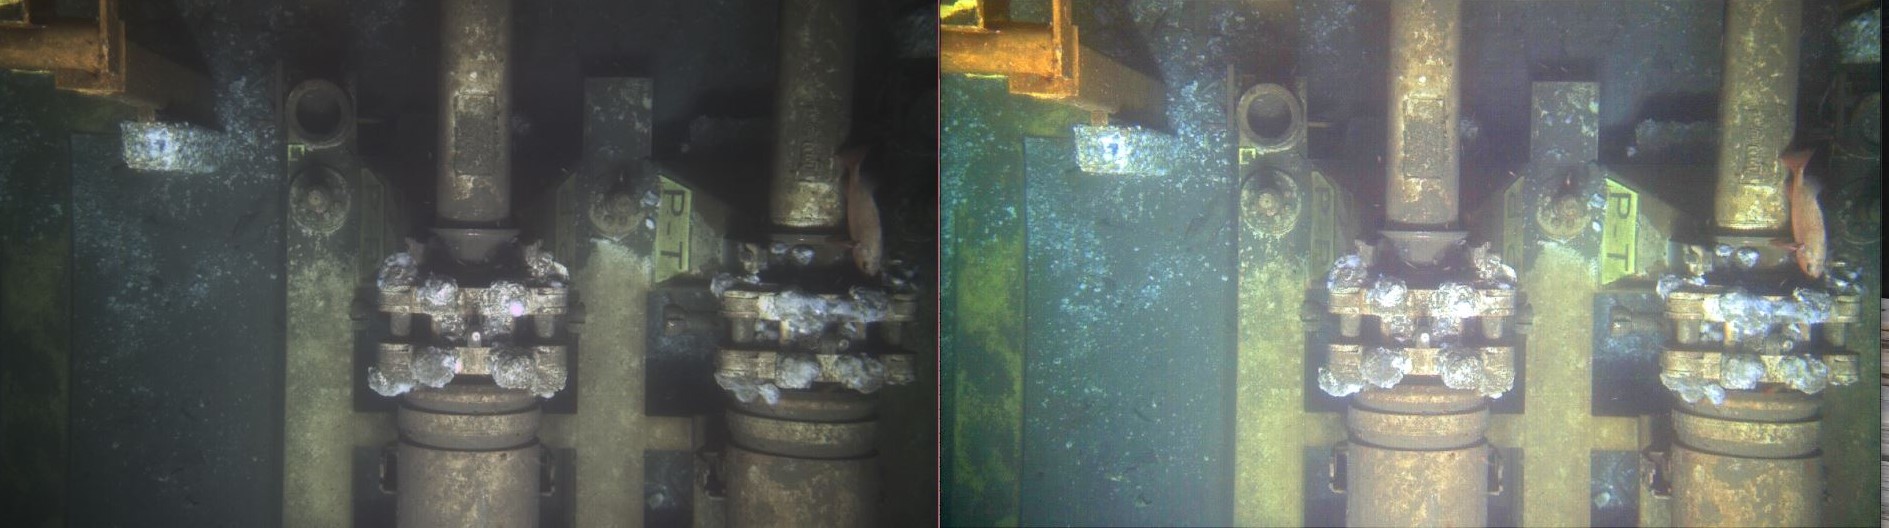
Even ROV images will have bright and dark areas due to absorption of light in water. The enhanced image to the right shows many hidden details in the left image.
|
|
|
|
Classification of images is difficult when 40% of the image is too dark. On the enhanced image to the right it is obvious that many hidden details in the left image can be seen.image can be seen. |
|
|
|
|
|
|
|
This classification is done automatically with use of features like roundness, colour, thickness etc. With enough samples, this type of image would be perfect for analysis with Deep Learning / Tensorflow.
|
|
|
|
|
|
|
|
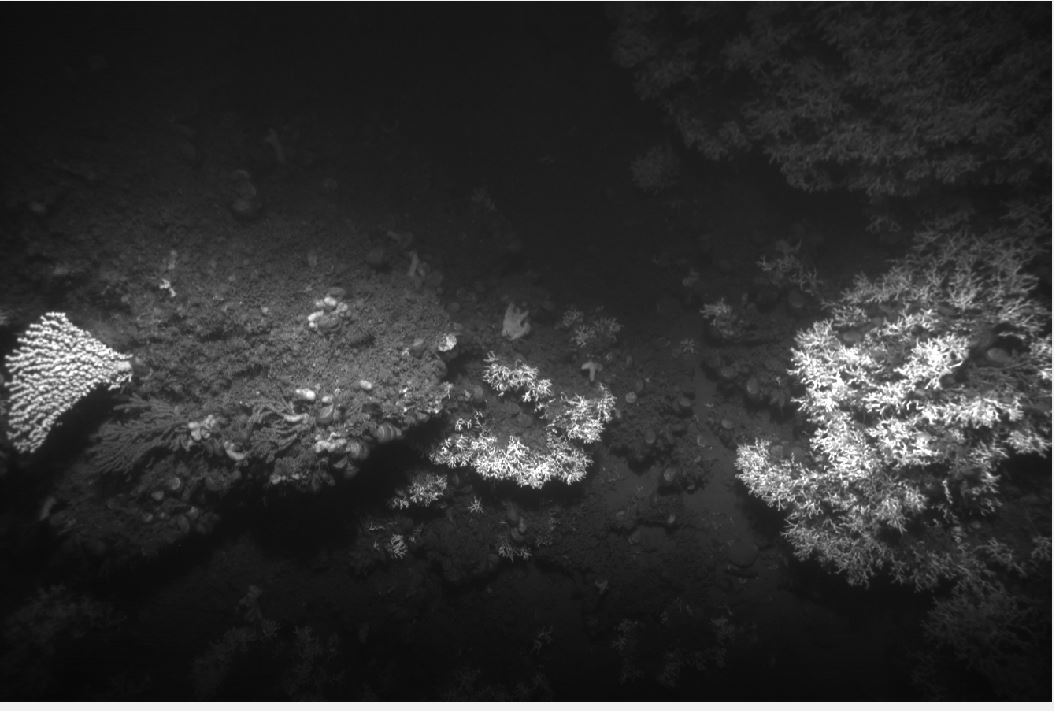
Finding corals with use of sonar |
|
|
Demo project for DOF Subsea |
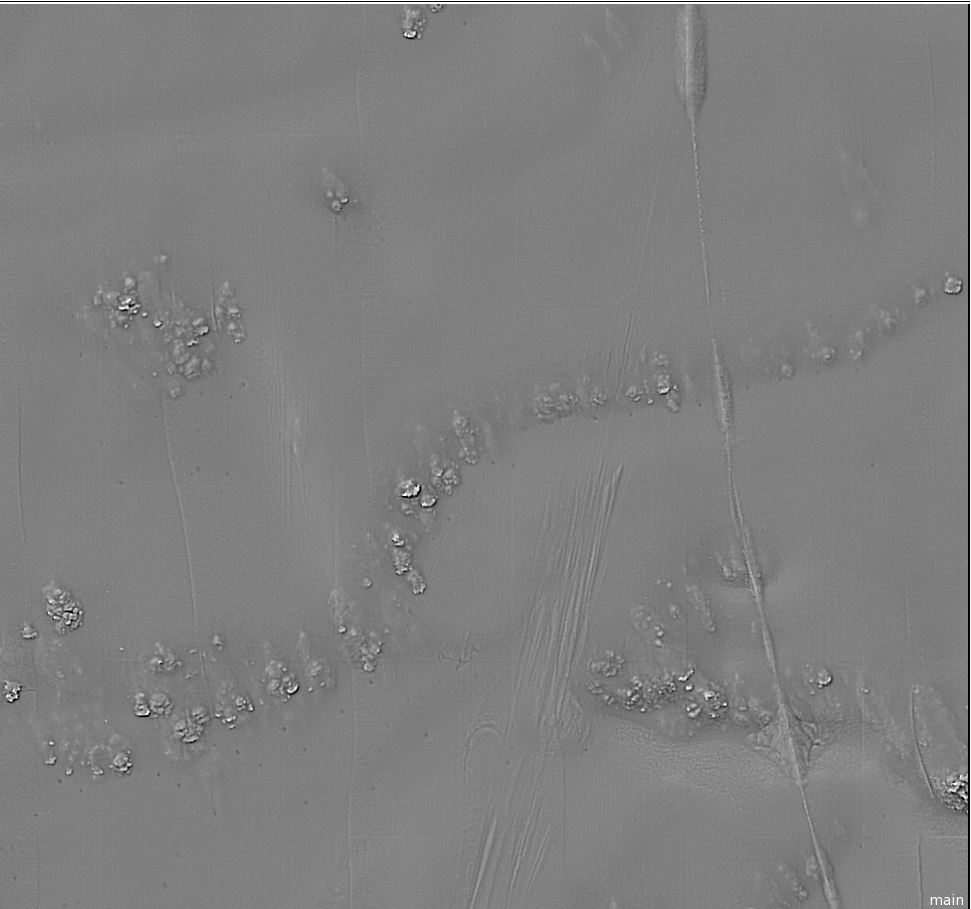
Finding corals in deep water in Northern areas is a challenge. The water is deep and there is no sunlight. With use of sonar it is still possible to map large areas and find corals. The geologists explained that coral in this deep water normally grows on large rocks/stones. |
|
|
|
|
|
|
|
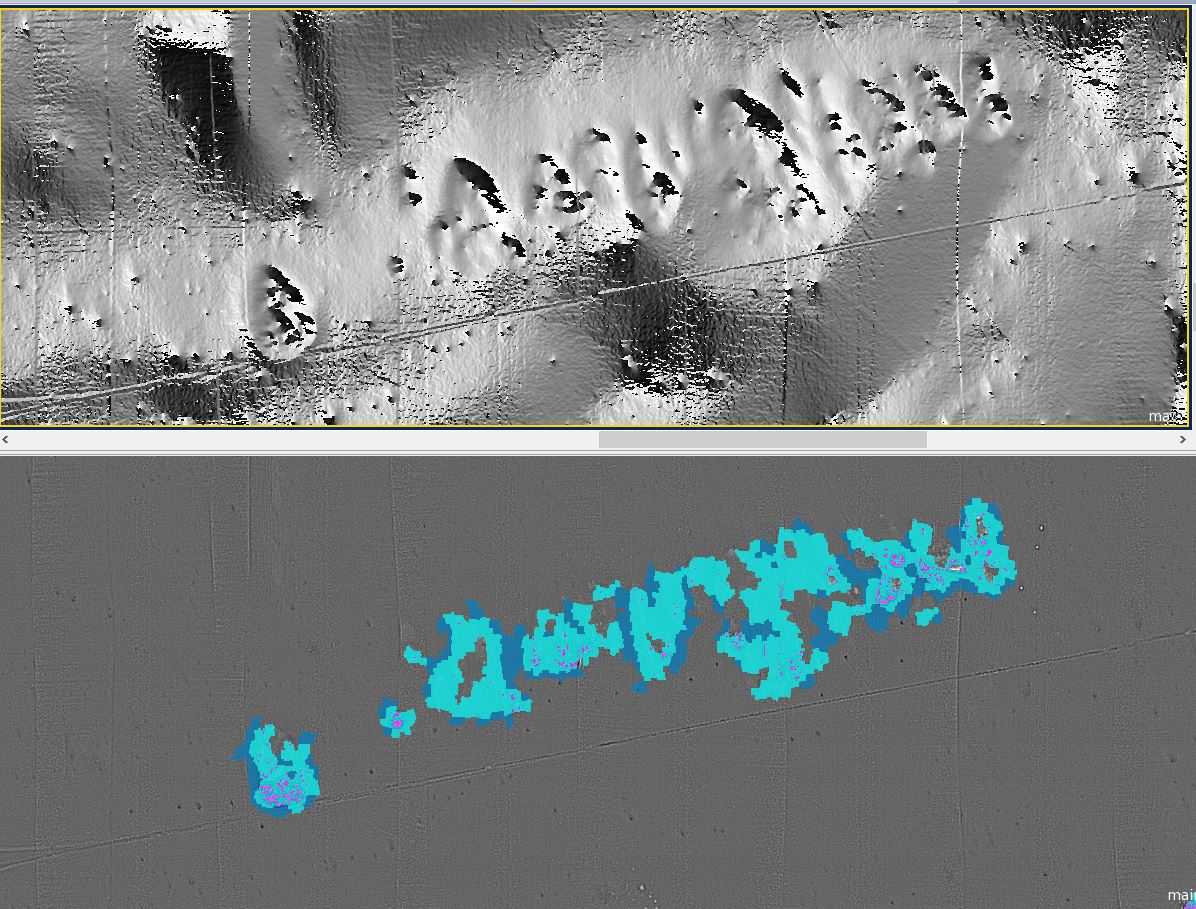
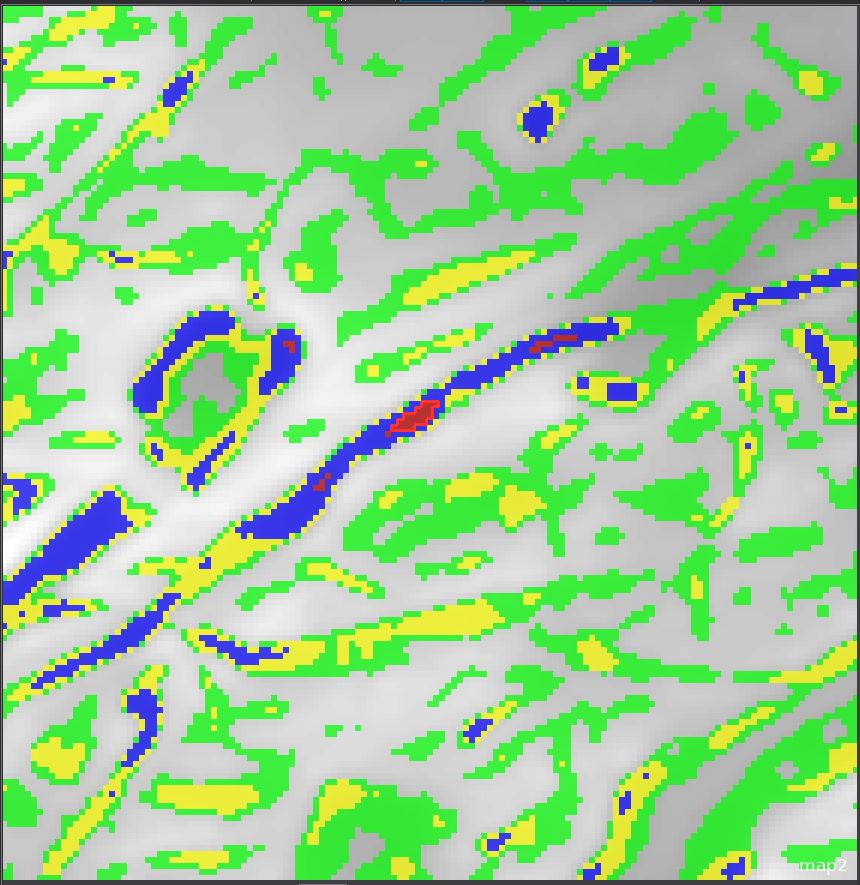
With use of BPI/TPI (Bathymetric/Terrain Position Index) it is possible to find the coral. eCognition can analyse large areas in few minutes.
|
|
|
|
|
|
|
|
This image shows the whole area analysed. One huge benefit by using a software like eCognition is that you get the same result every time you process the data. |
|
|
|
|
|
|
|
|
|
|
|
|
|
|
|
Oil spill analysis |
|
|
|
The project aimed to find oil leaks at the pipe line. There were challenges with data quality, but oil leaks as drops that trickle up can be found.
|
|
|
|
Here classification is done in original image and in enhanced image.in enhanced image.
|
|
|
|
Part of the project was to visualise how enhancement can improve the images.
|
|
|
|
Another example of enhancement.
|
|
|
|
Enhancement was done automatically for 250 000 images. For each image the program analysed the content and enhanced the image accordingly. Subsea images normally come in thousands and all work has to be automatic. to be automatic. |
|
|
|
|
|
|
|
|
|
|
|
|
|
|
|
Hunting debris at the seabed around fish farms. |
|
|
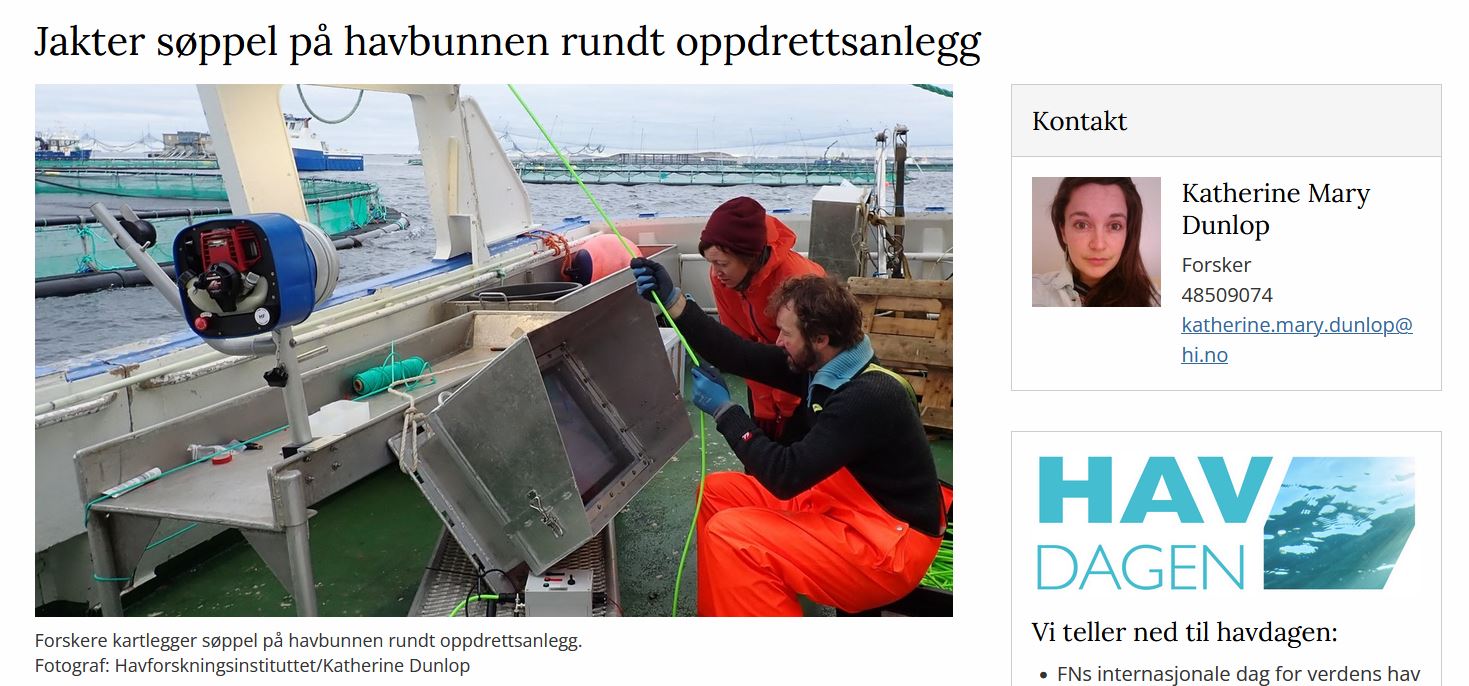
Project for Institute for Marine Research (IMR) (Havforsknings instituttet) |
 |
|
|
|
About
The goal for this project was to detect debris around and from fish farms. IMR had travelled several routes around fishfarms and taken many images with and ROV submarine.
TerraNor together with Akvaplan-niva developed routines in eCognition to automatically detect any debris around in the images. The challenge was that we did not know what to look for. Debris could be any thing from plastic bags to empty food cans or old buckets.
Partners for image analysis part of the project
Institute for Marine Research, Tromsø
Akvaplan-niva
TerraNor
How we did it
There were no samples or not enough samples to use machine learning and definitely not deep learning (AI).
And often we had only one sample of the object we were looking for.
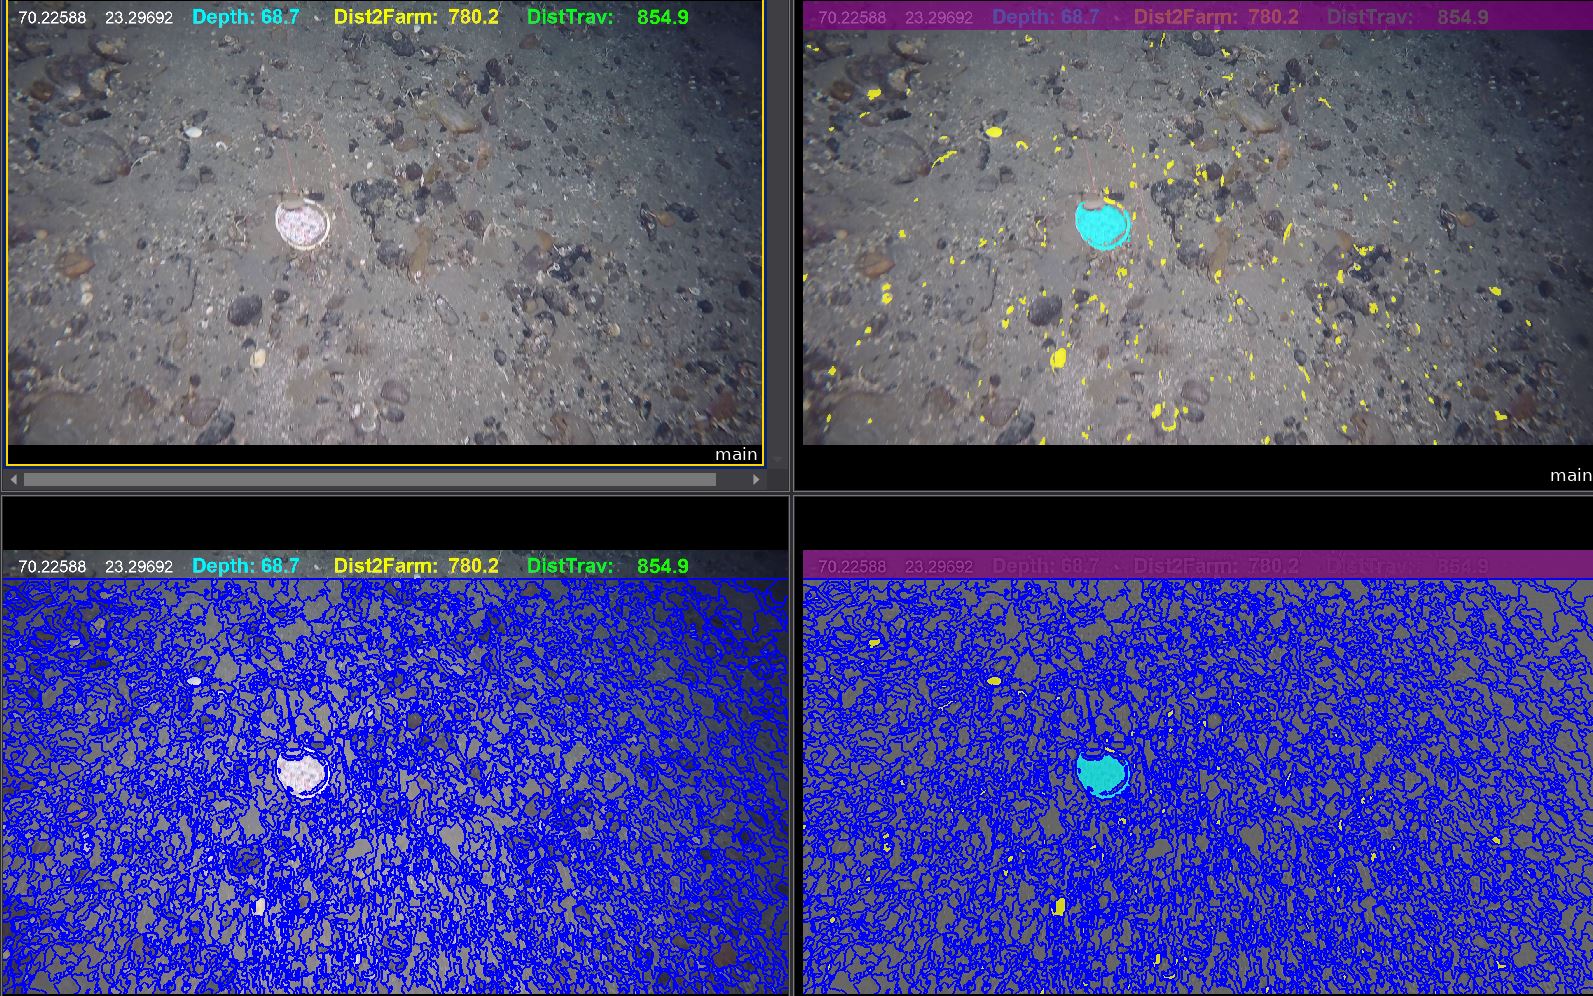
We decided that distinct colours of red, green, blue, yellow and similar clear colours were not natural and could be debris.
Shape of man-made objects are often different from natural objects. We used roundness or elliptic form to distinguish debris from mother nature.
The samples below show how it was done.
|
|
|
|
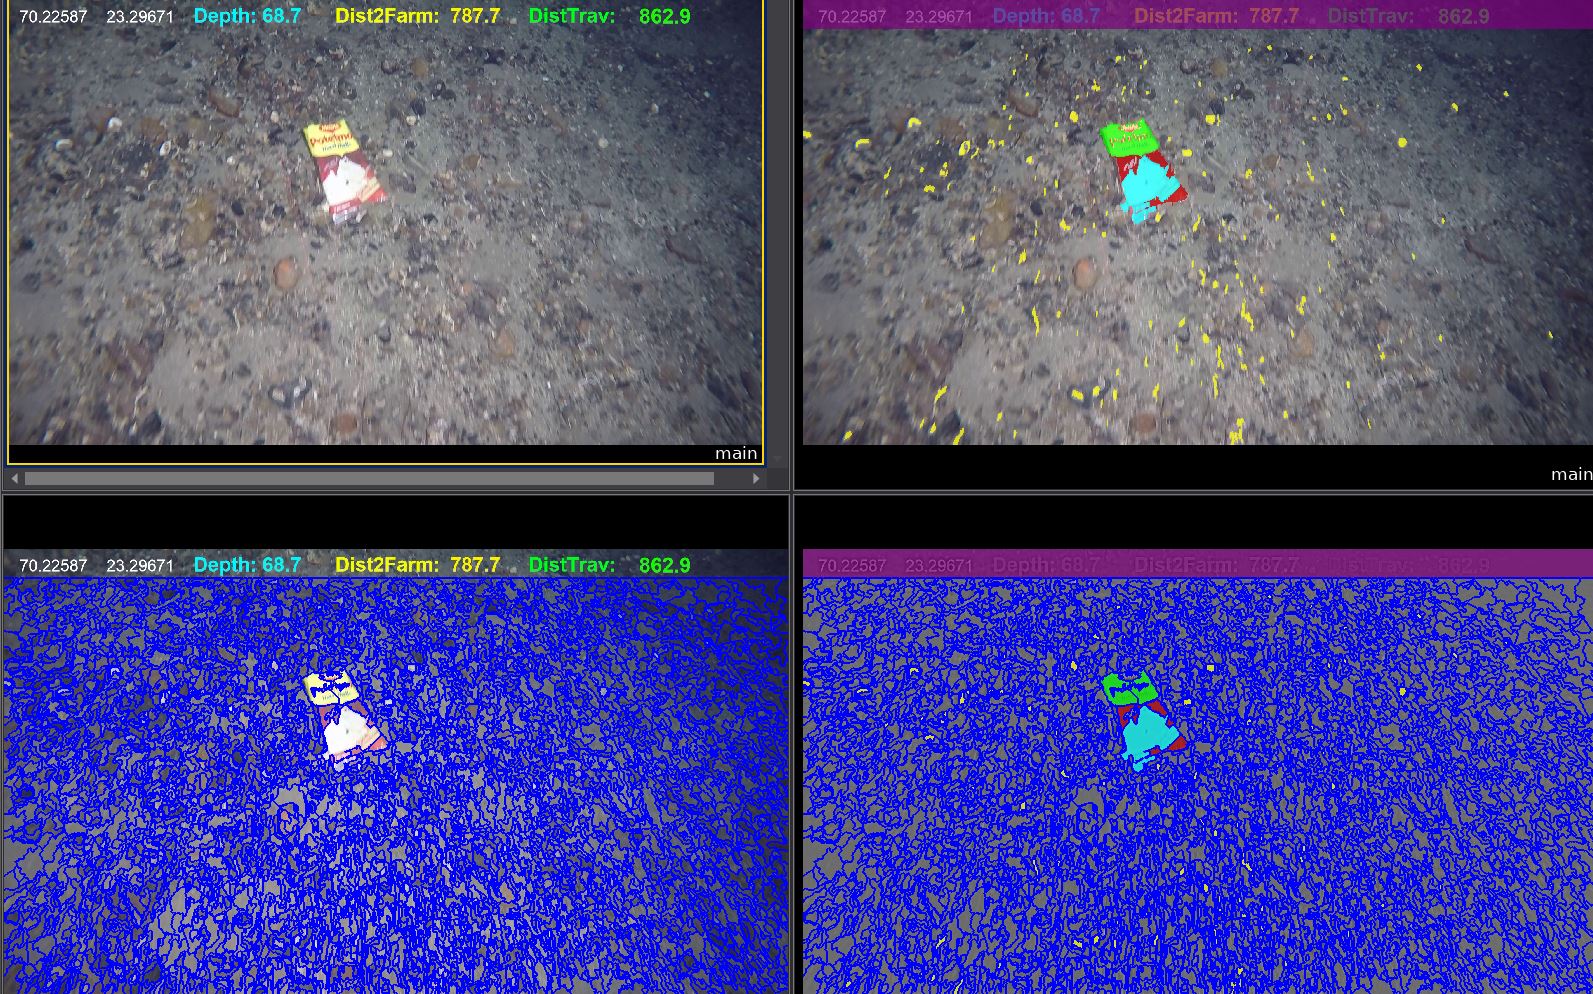
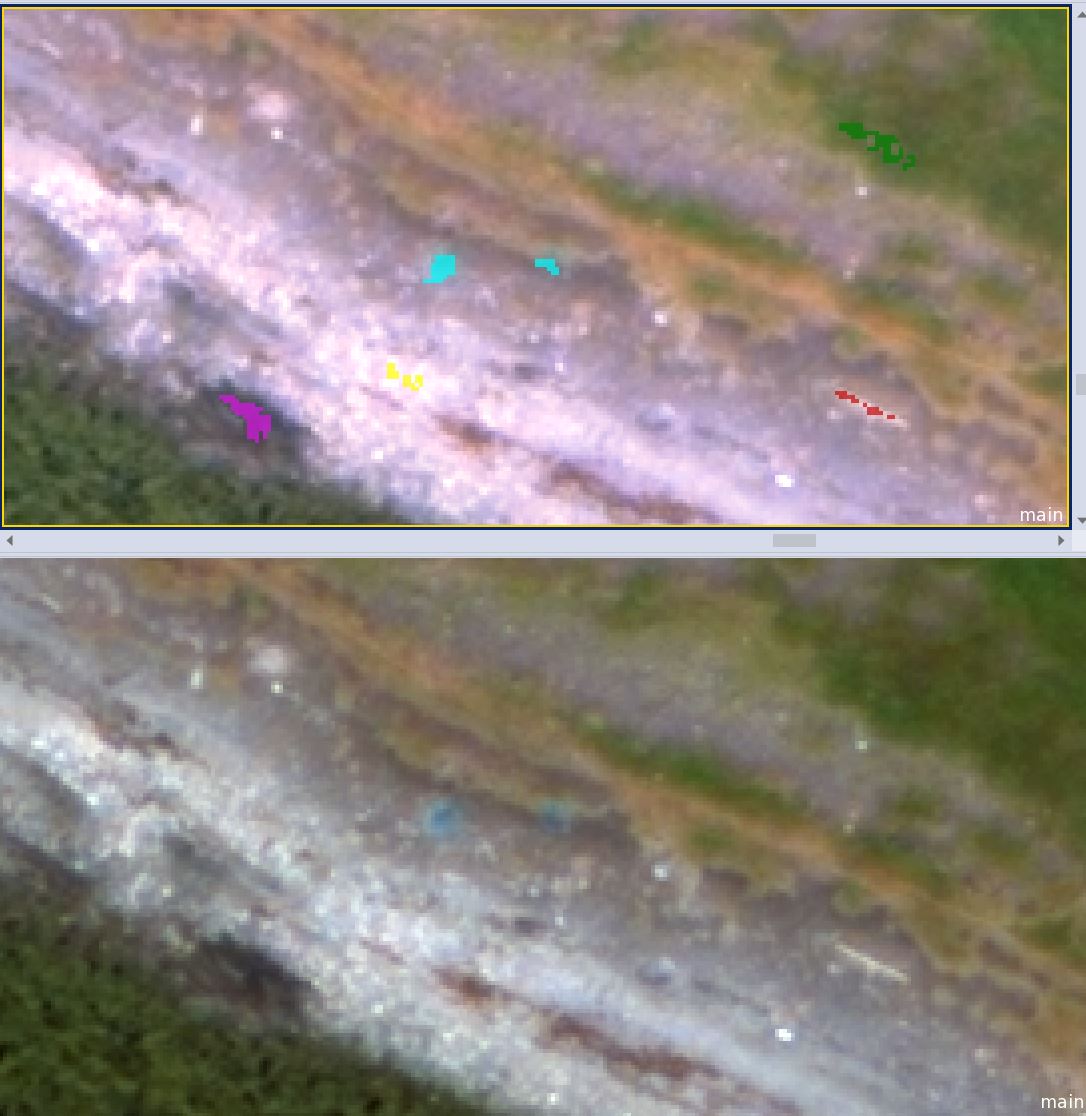
In this image red, grenn/yellow and white plastic was found. Yellow objects are white fauna on the seabed.
|
|
|
|
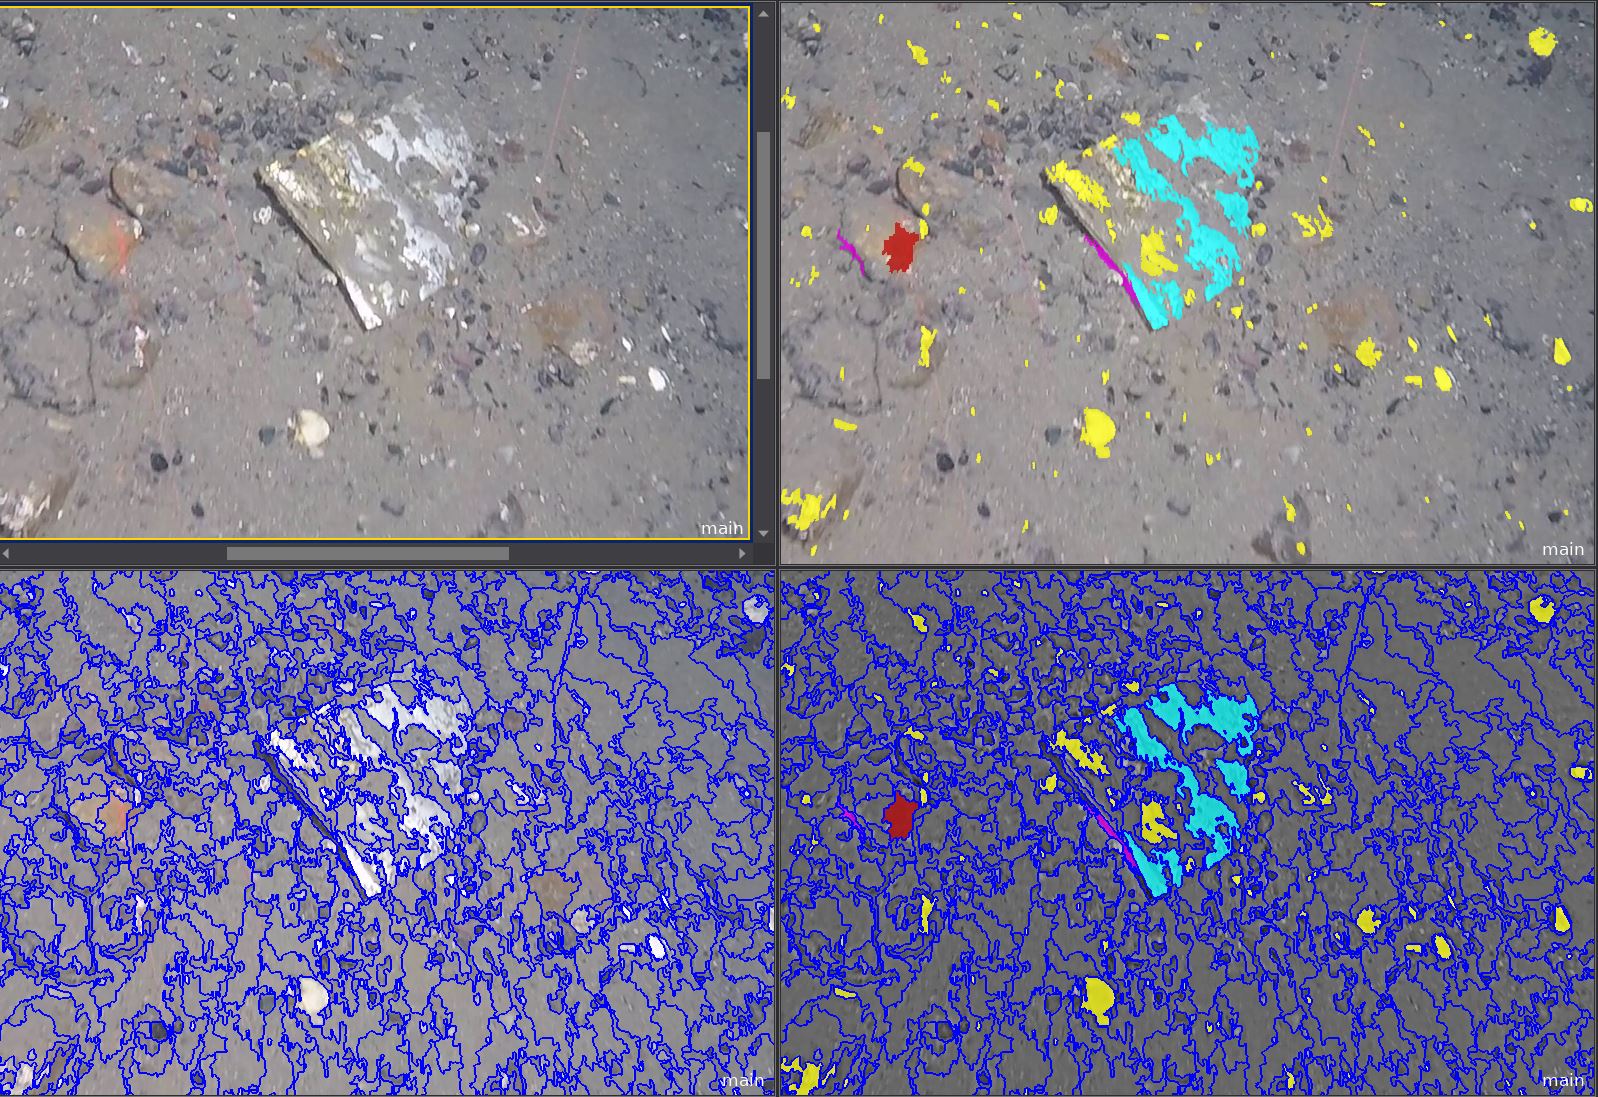
White plastic is difficult to distinguish from fauna.Especially when half the plastic is covered with mud. The images were 8 bit jgp files. With 16 bit tiff files it would probably be easier to distinguish fauna from debris.
|
|
|
|
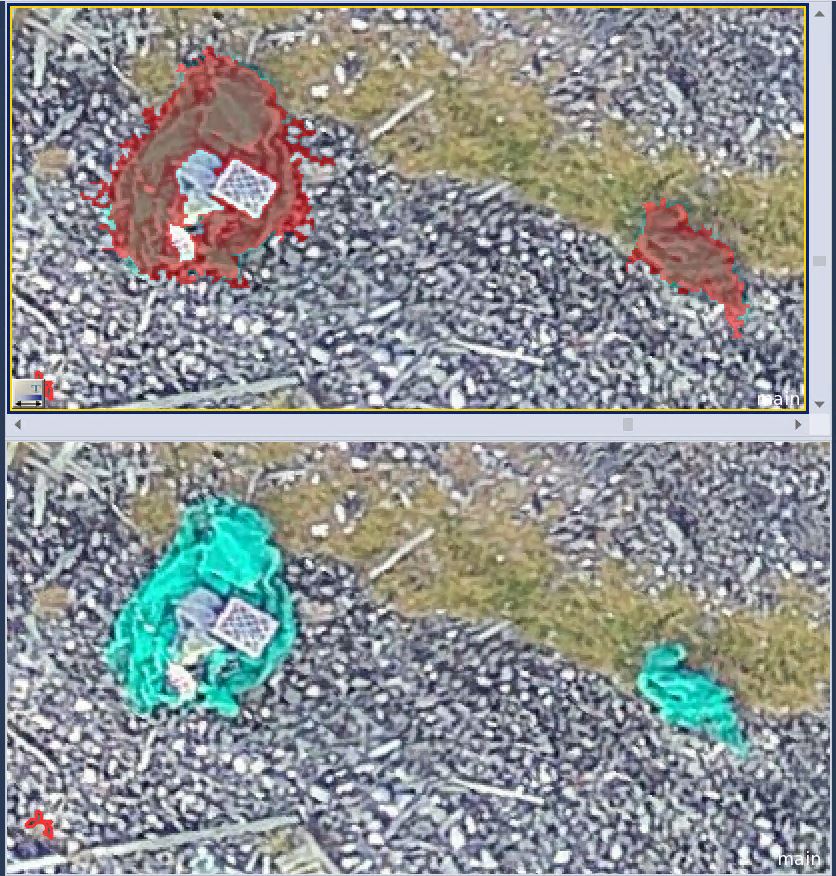
In this image we used both colour and roundness to distinguish plastic from fauna.
|
|
|
|
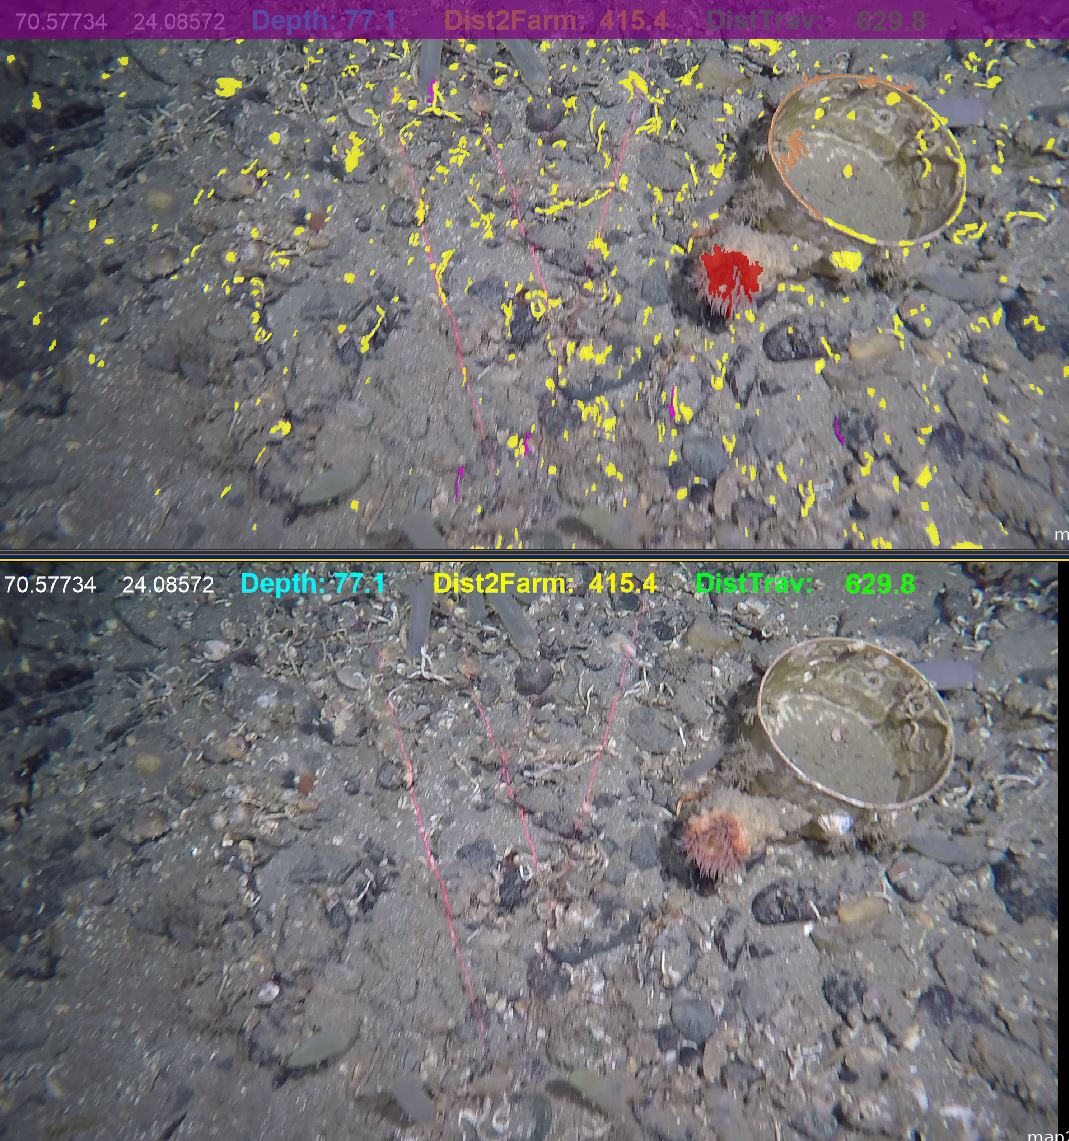
This bucket was found thanks to the shape - roundness.shape - roundness. |
|
|
Summary |
If you know what to look for and have many samples, you can use machine learning techniques to classify the contents of your images. In this project we managed to solve the problem with missing samples by using HI (Human Intelligence) combined with eCognitions several hundred functions for object analysis.
The main feature in eCognition is segmentation. Segmentation can use any raster (here the image channels) to create objects (polygons) that contain pixels that statistically belong to same type of object. Based on these segmented objects it is possible to classify the objects based on colour, shape, texture or any other of the many feature types in eCognition.
Thanks to eCognition rich number of features it is possible to classify images without using samples and machine learning or deep learning (AI). |
|
|
|
|
|
|
|
|
|
|
|
|
|
|
Projects with Akvaplan-niva |
 |
|
|
|
TerraNor has done several projects together with Akvaplan-niva. TerraNor was responsible for image analysis. Below are the main projects. |
|
|
|
 |
|
|
|
 |
|
|
|
About
The goal for TerraNor in Dimarc and Malinor projects were to support Akvaplan-niva to find debris on the beaches of norther Norway using satellite and drone images.
The projects contains several objectives that can be found under links below. Here we will show some of the results of remote sensing analysis that TerraNor did together with Akvaplan-niva.
Dimarc and Malionor were similar regarding to use of remote sensing, so the analysis were combined in one method development.
After the invasion in Ukraine, cooperation with Russian partners were stopped.
More information about projects can be found in links below.
The sub-objectives were
Develop rulesets in eCognition that can be used in other projects. The methodology and rulesets from Dimarc and Malinor were later used in Criptic.
Datasets from Maxar (European Space Imaging) World View 3 30 cm images were compared to drone images to evaluate the difference in findings. The most important feature, fishnet, could be found in both datasets.
The Dimarc project included analysis of glider images.
Project areas:
The studied areas were in remote beaches in Finnmark and Troms counties (now merged). Both rock and sand beaches were included in the study. Both types of beaches gave good results in finding fishnet and other plastic.
Partners
Akvaplan-niva
Norsk institutt for luftforskning
UiT
SOI
Meteorologisk institutt
Murmansk Marine Biological Institute
Maritime Robotics AS
GRID-Arendal;
TerraNor
Association Maritime Heritage
Zubov State Oceanographic Institute of Roshydromet
WWF Russia
Funding
Forskningsrådet (Malinor)
Handelens Miljøfond (Dimarc)
|
|
|
|
eCognition were used in analysis of satellite, drone and glider images. |
|
|
|
|
|
|
|
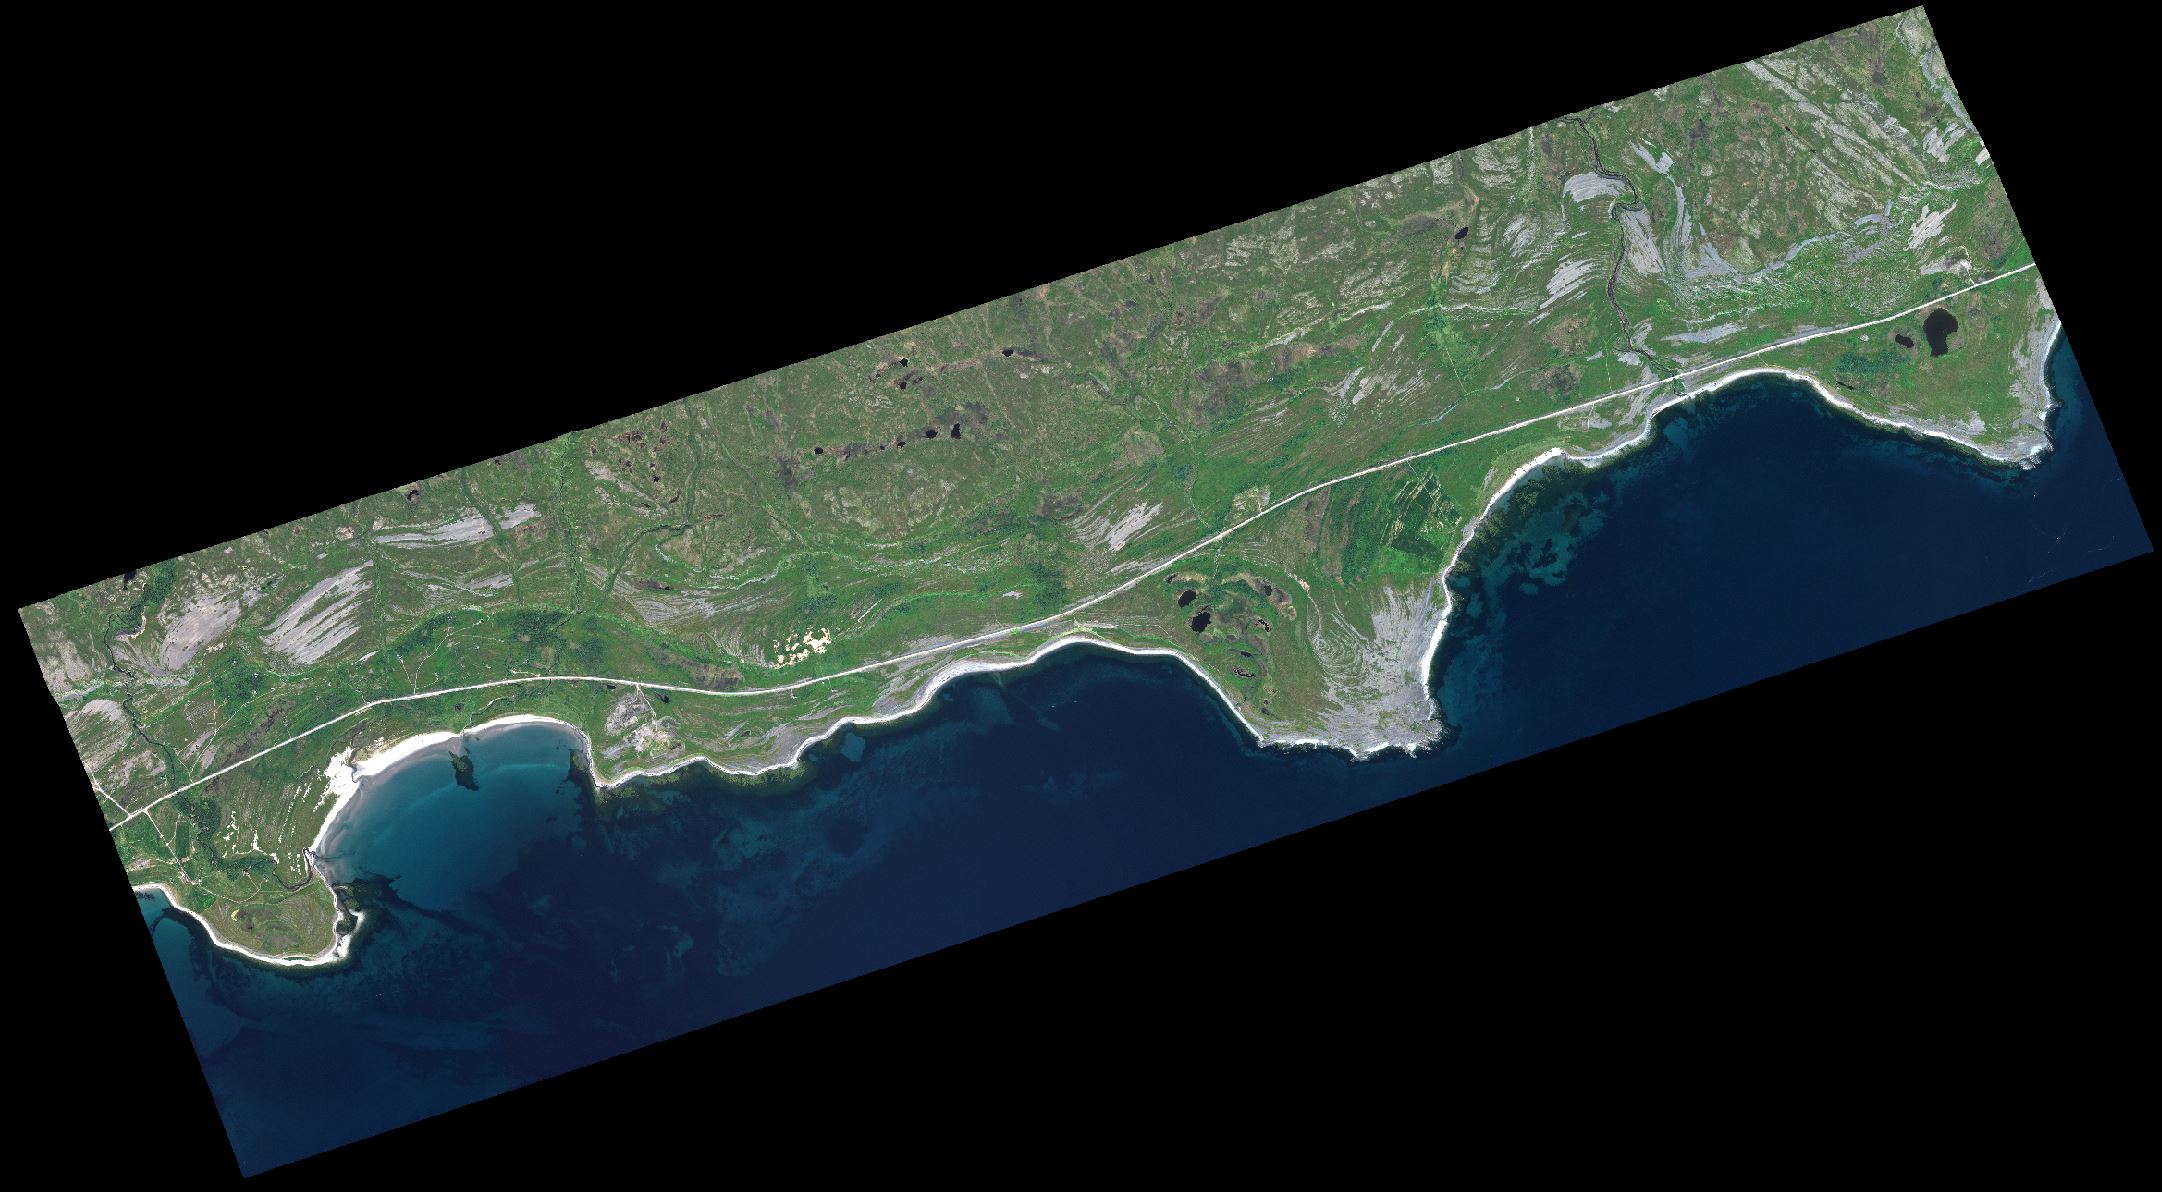
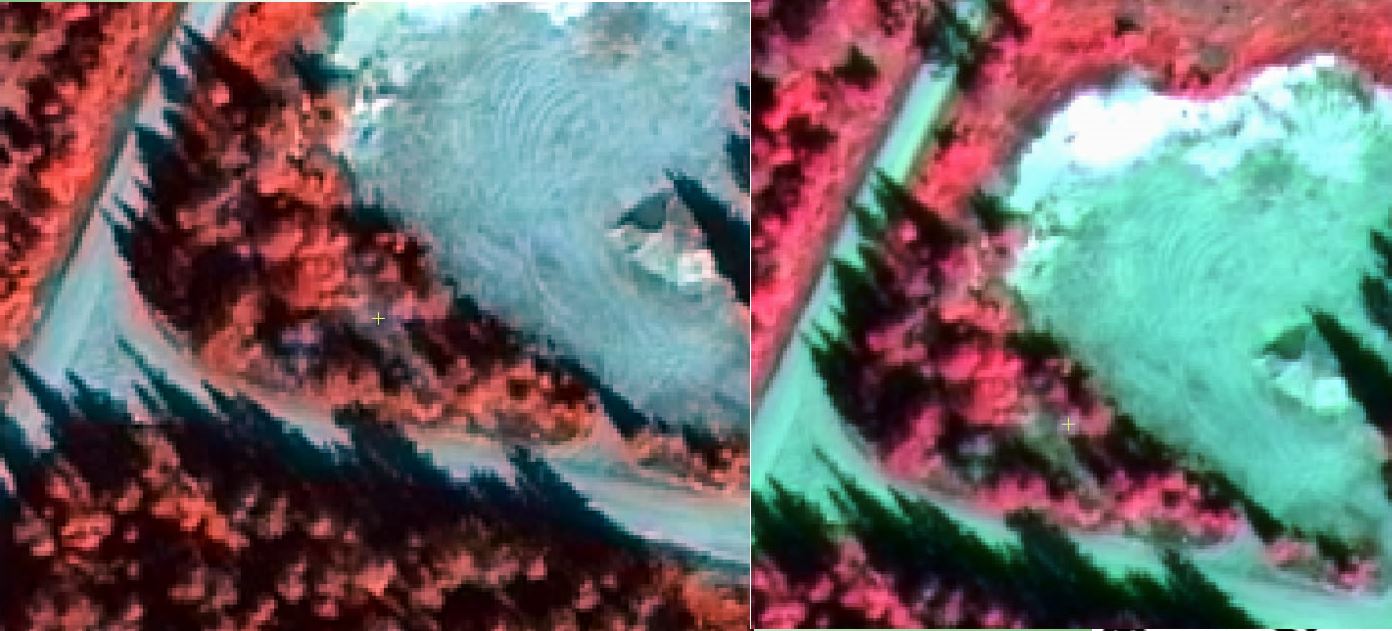
WorldView 3 image of Svartneset in 'normal' colours (RGB).
|
|
|
|
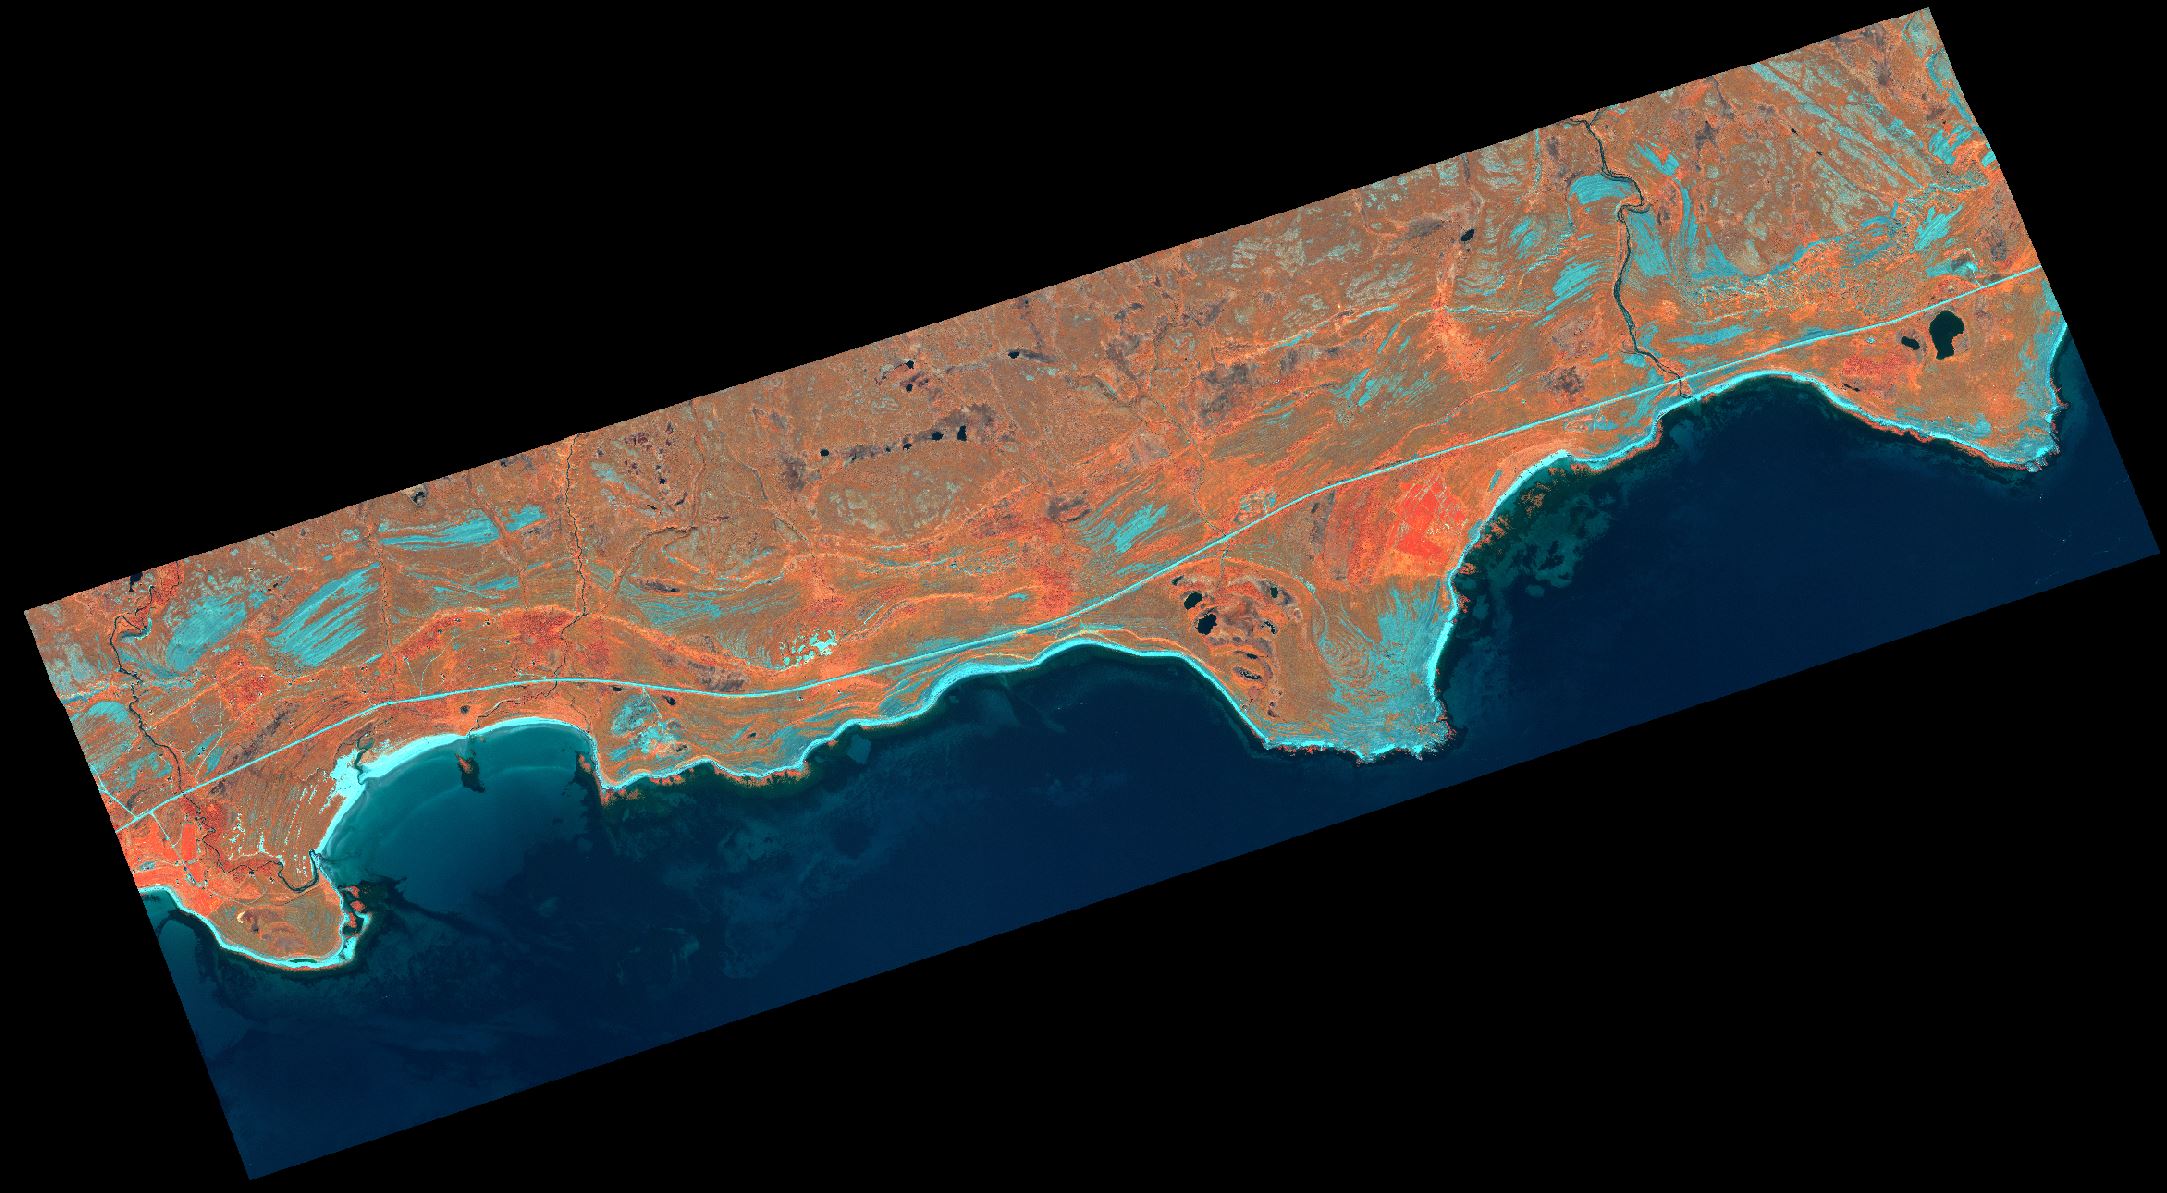
WorldView 3 image of Svartneset in 'false' colours (IR GB)
The benefit of using high resolution satellite images (30cm) are
- Large coverage
- No need for transport to remote areas
- Can be ordered at short notice
- Can detect small objects down to 40-50 cm
- Includes IR channels that detects vegetation better than RGB
- IR also detects seaweed
- 16 bit data (11 bit sensor) give better radiometric resolution
We want to thank European Space Imaging for letting us order special images with only 3km width since we were only interested in the coastline. EUSI is very flexible in managing orders for new images - and very fast to deliver!. Great professional people to work with in Munich.
|
|
|
|
|
|
|
|
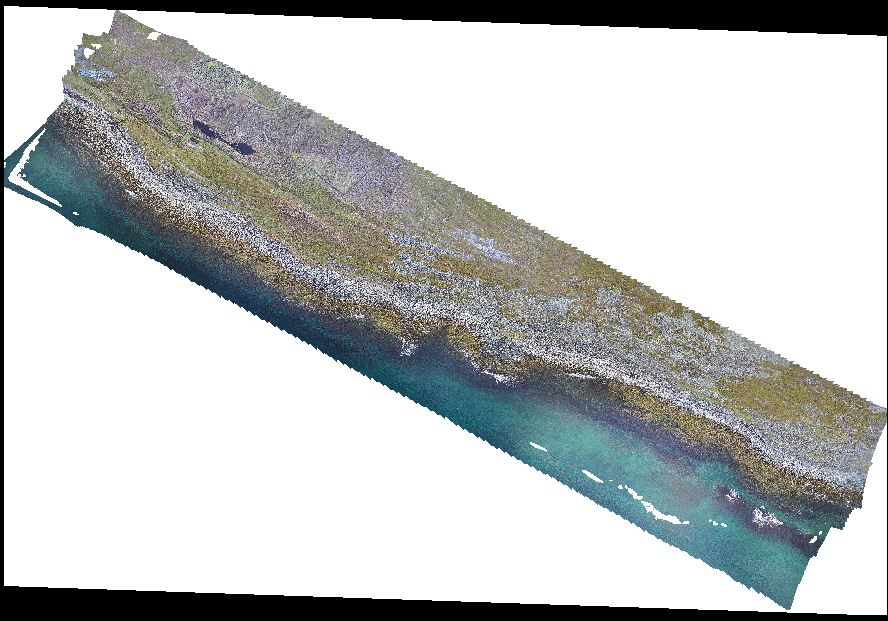
Drone image of the study area, part of Svartneset.
Maritime robotics drone and DJI Phantom 4 Pro V2 were used.
Benefit of using drone images:
- Extreme high resolution, down to 2-3 mm
- Can map exactly specified area and nothing more
- Can fly even with high clouds - not fog
- Our drones had high quality cameras
- IR camera can be includes, but the quality is less than RGB
- Even small parts of fishnet lying under sand can be detected
Mosaicking of drone images was done in Agisoft.
|
|
|
|
|
|
|
|
Fishnet found in drone images.
|
|
|
|
Fishnet found in WorldView 3 image |
|
|
|
|
|
|
Links |
Marine litter monitoring cruise
Webinar series on Marine Litter in the Barents Sea
Multicopter-drones map marine litter in the Arctic
Kartlegging av makroplast med droner, satellittbilder og maskinlæring - Norwegian
Hunting for plastic: new digital technology to find and map marine litter
Nye metoder for detektering av makroplast ved bruk av droner, satellittbilder og maskinlæring- Norwegian
|
|
|
|
|
|
|
Criptic project |

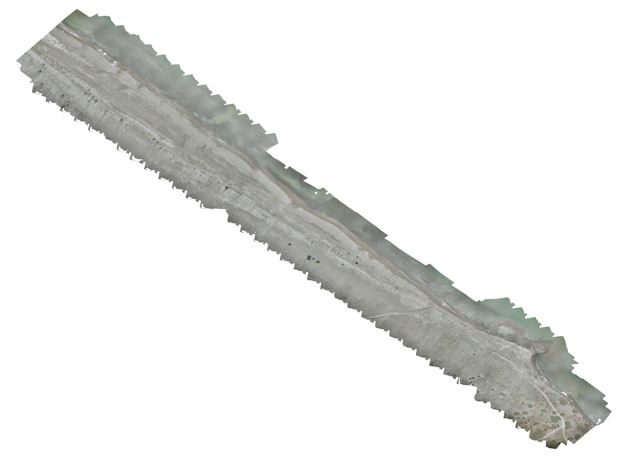
Project are mapped with drone. |
|
|
|
About
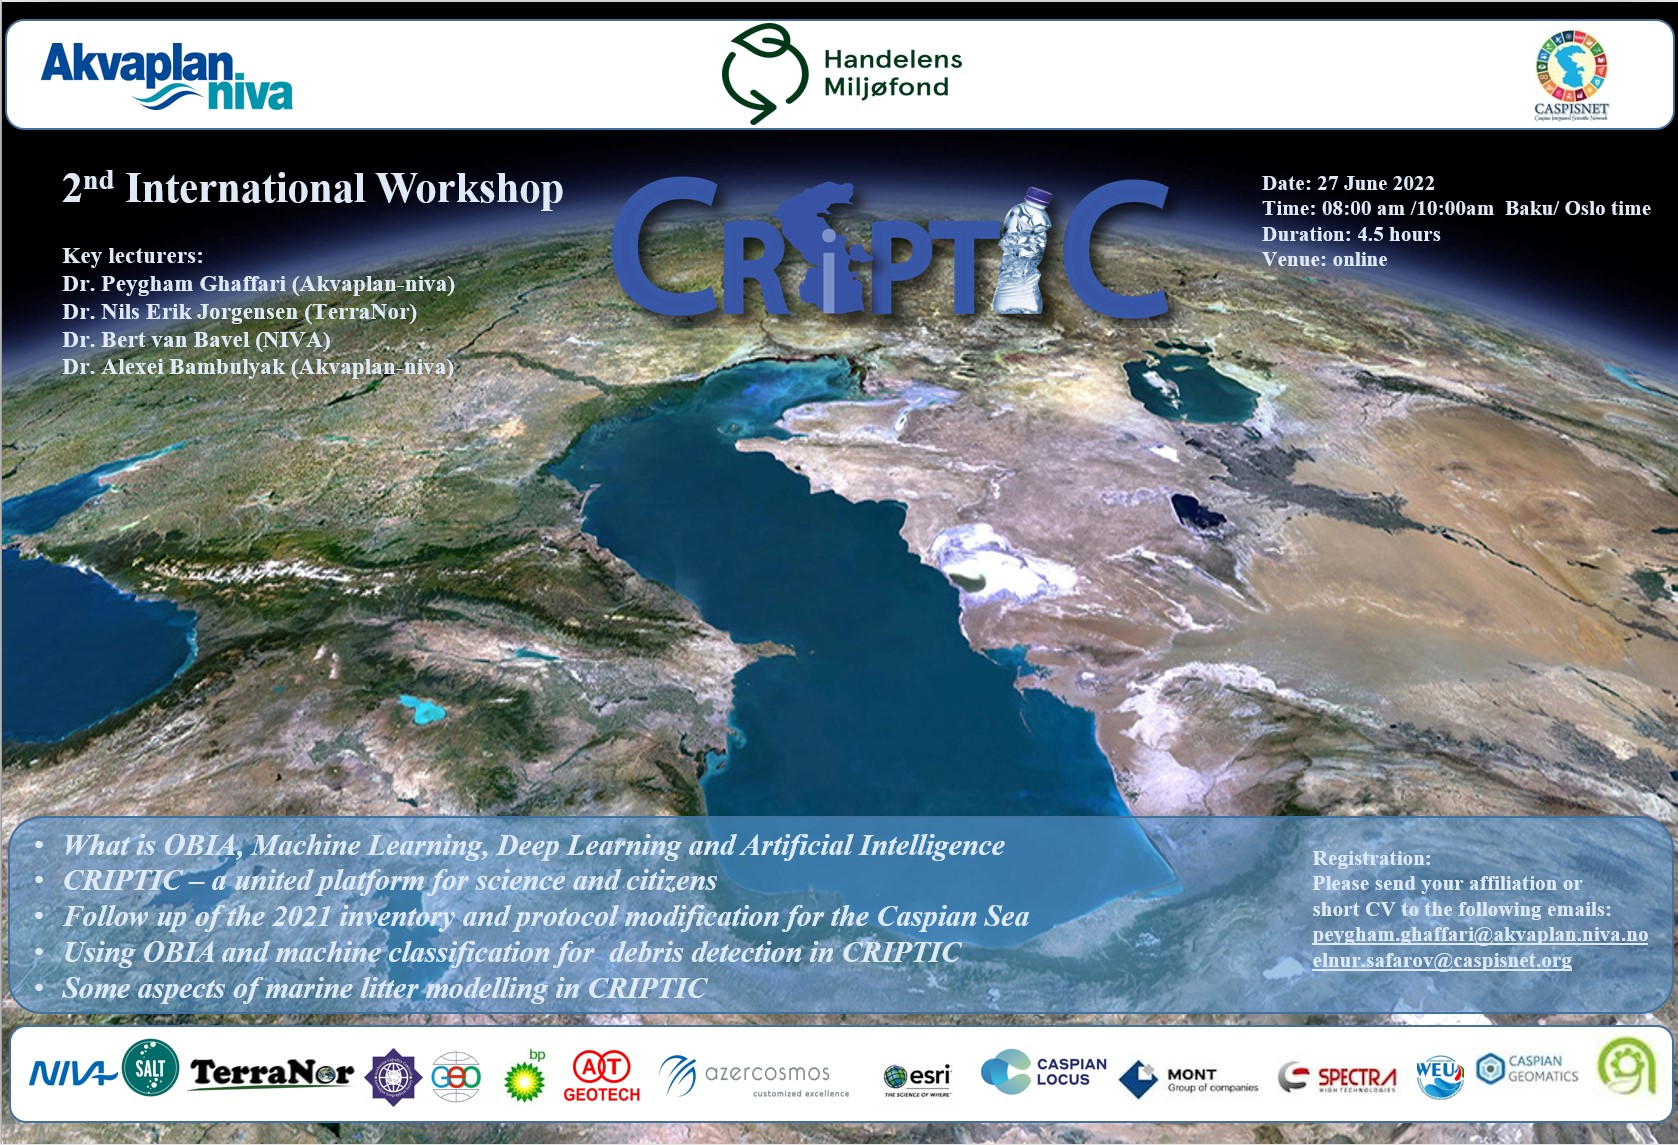
The main aim of the CRIPTIC project (Cleaning Riverine Plastic from a Transboundary Inflow to the Caspian) is to apply digital methods and community engagement to reduce plastic waste in the Caspian Sea.
The sub-objectives were
To harmonize mapping methods,
to mobilize local organizations in mapping and cleaning operations
to run a local pilot project on plastic waste mapping and cleaning using multidisciplinary tools and
to raise public awareness and community engagement in combating plastic waste.
The project combined a range of advanced digital methods, educational programs, and citizen science to engage local stakeholders in plastic mapping and clean-up activities. CRIPTIC considers the transboundary Kura River mouth and the adjacent coastal area as the pilot area for mapping, identification, and cleaning of plastic waste in the Caspian region. Crossing three countries, the Kura River is the biggest river of Azerbaijan and is considered as the second water supplier to the Caspian Sea.
Partners
Akvaplan-niva
Norwegian Institute for Water Research (NIVA)
SALT
TerraNor
Azerbaijanian Geographical Society (AGS)
Institute of Geography of the Azerbaijan National Academy of Sciences (IGA)
Sukanal SRDI of Azersu
Water Expert Union (WEU)
AT-Geotech
Azercosmos
Caspian Integrated Scientific Network (CASPISNET)
Funding
Handelens Miljøfond (The Norwegian Retailers’ Environmental Fund) Project ID 11560 |
|
|
Videoes |
CRIPTIC first workshop (part 1)
CRIPTIC first workshop (part 2)
CRIPTIC first workshop (part 3)
CRIPTIC second workshop (part I)
Includes lecture for remote sensing
CRIPTIC second workshop (part II)
CRIPTIC first clean-up campaign along the Caspian coast and Kura River
CRIPTIC second clean-up campaign along the Caspian coast
|
|
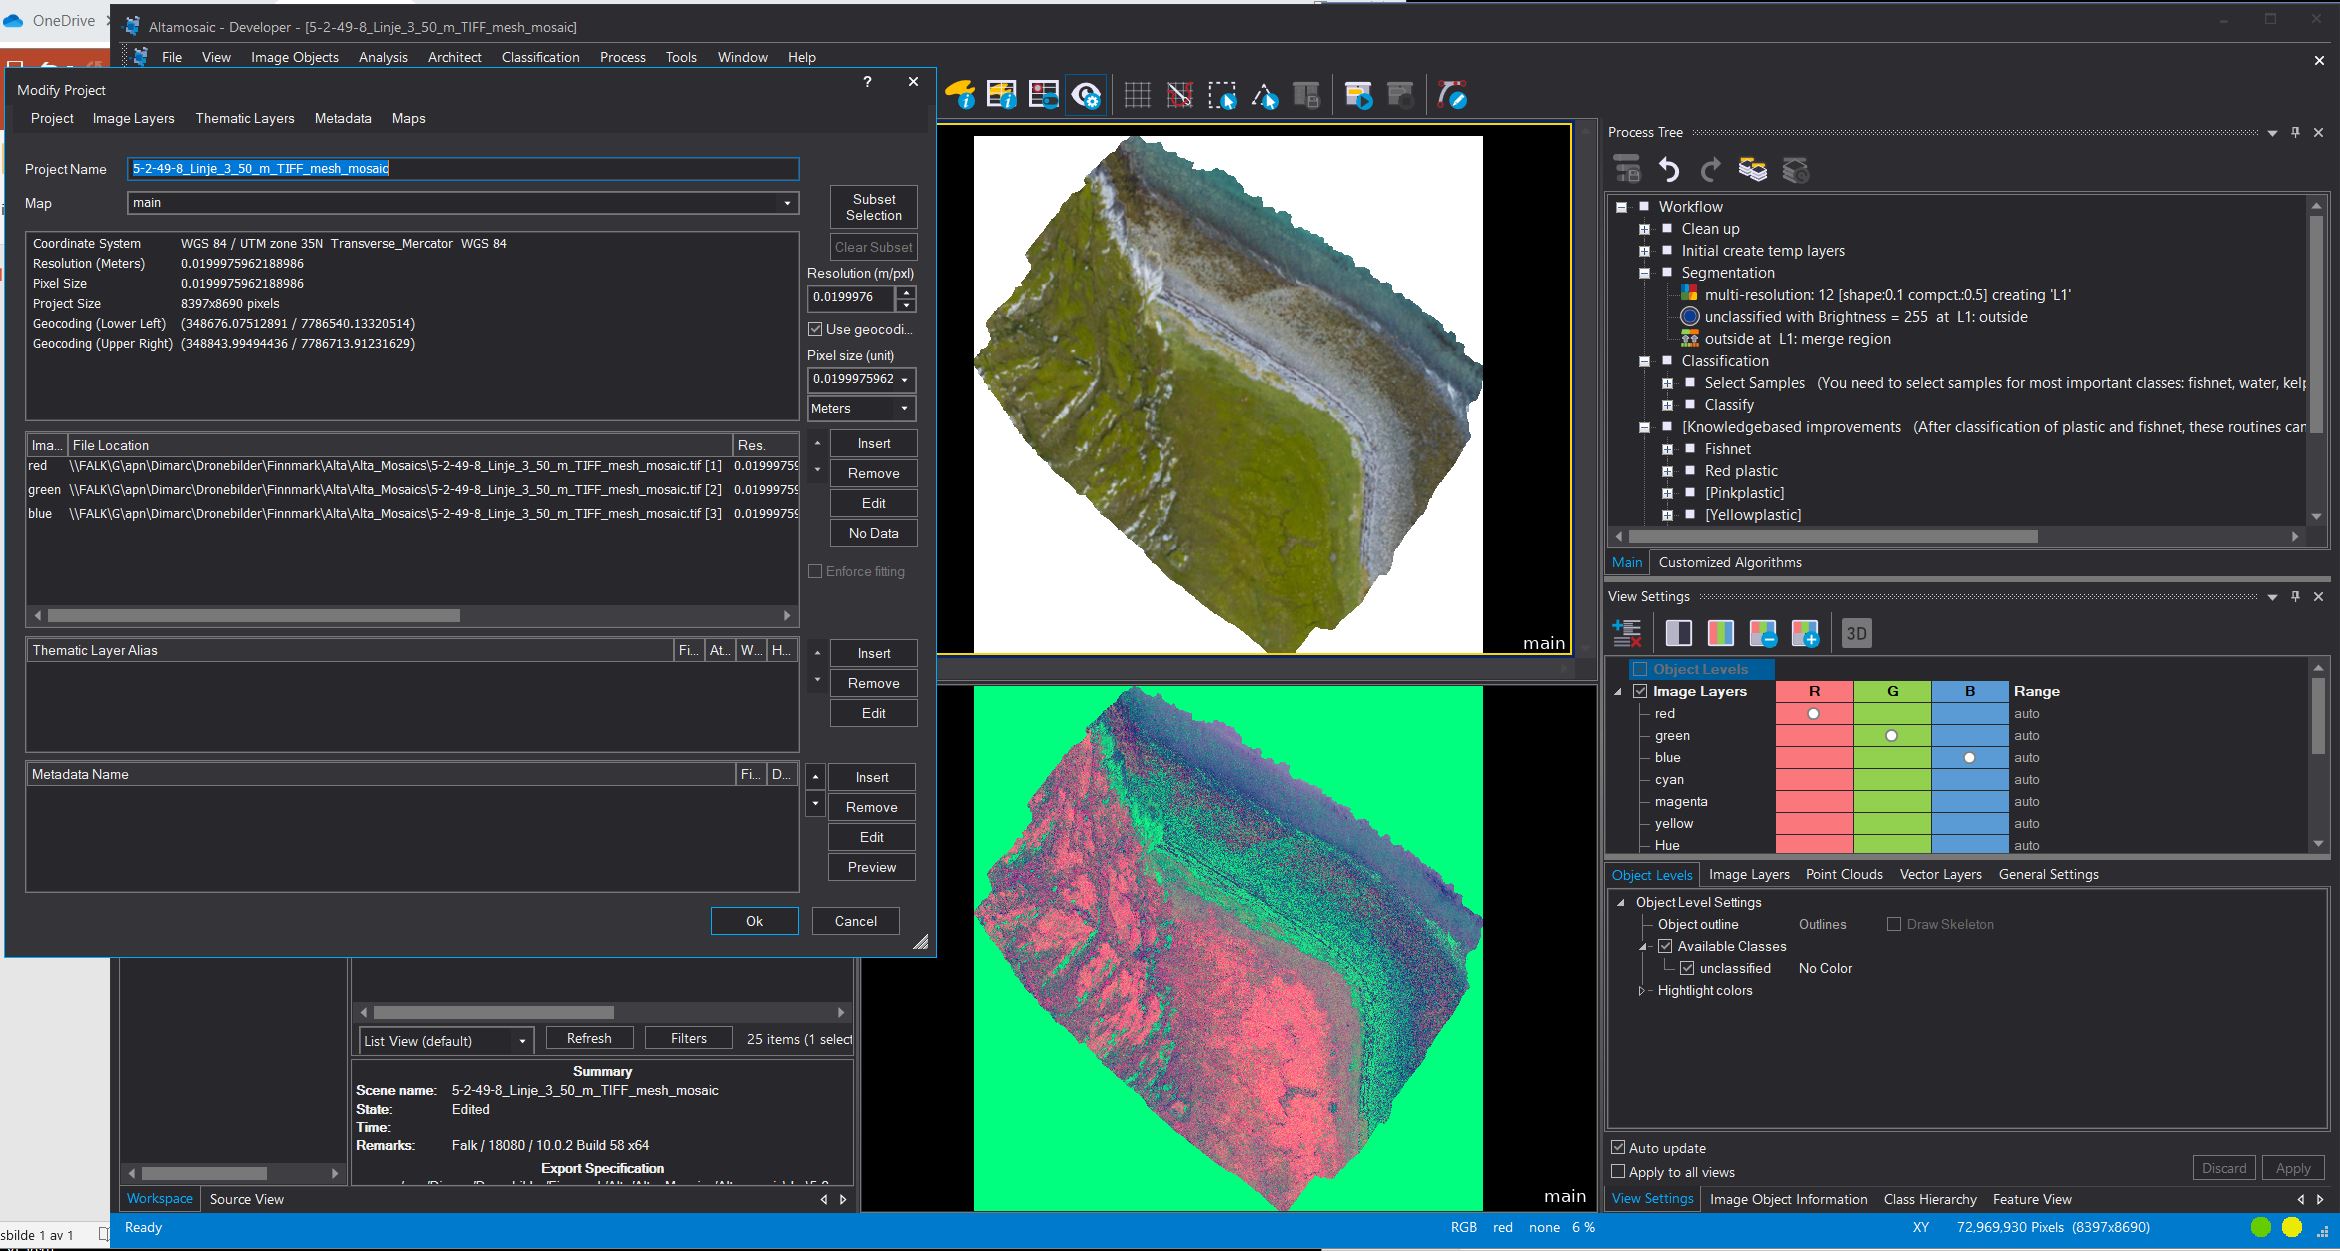
Classification of drone orthomosaic
Remote sensing analysis |
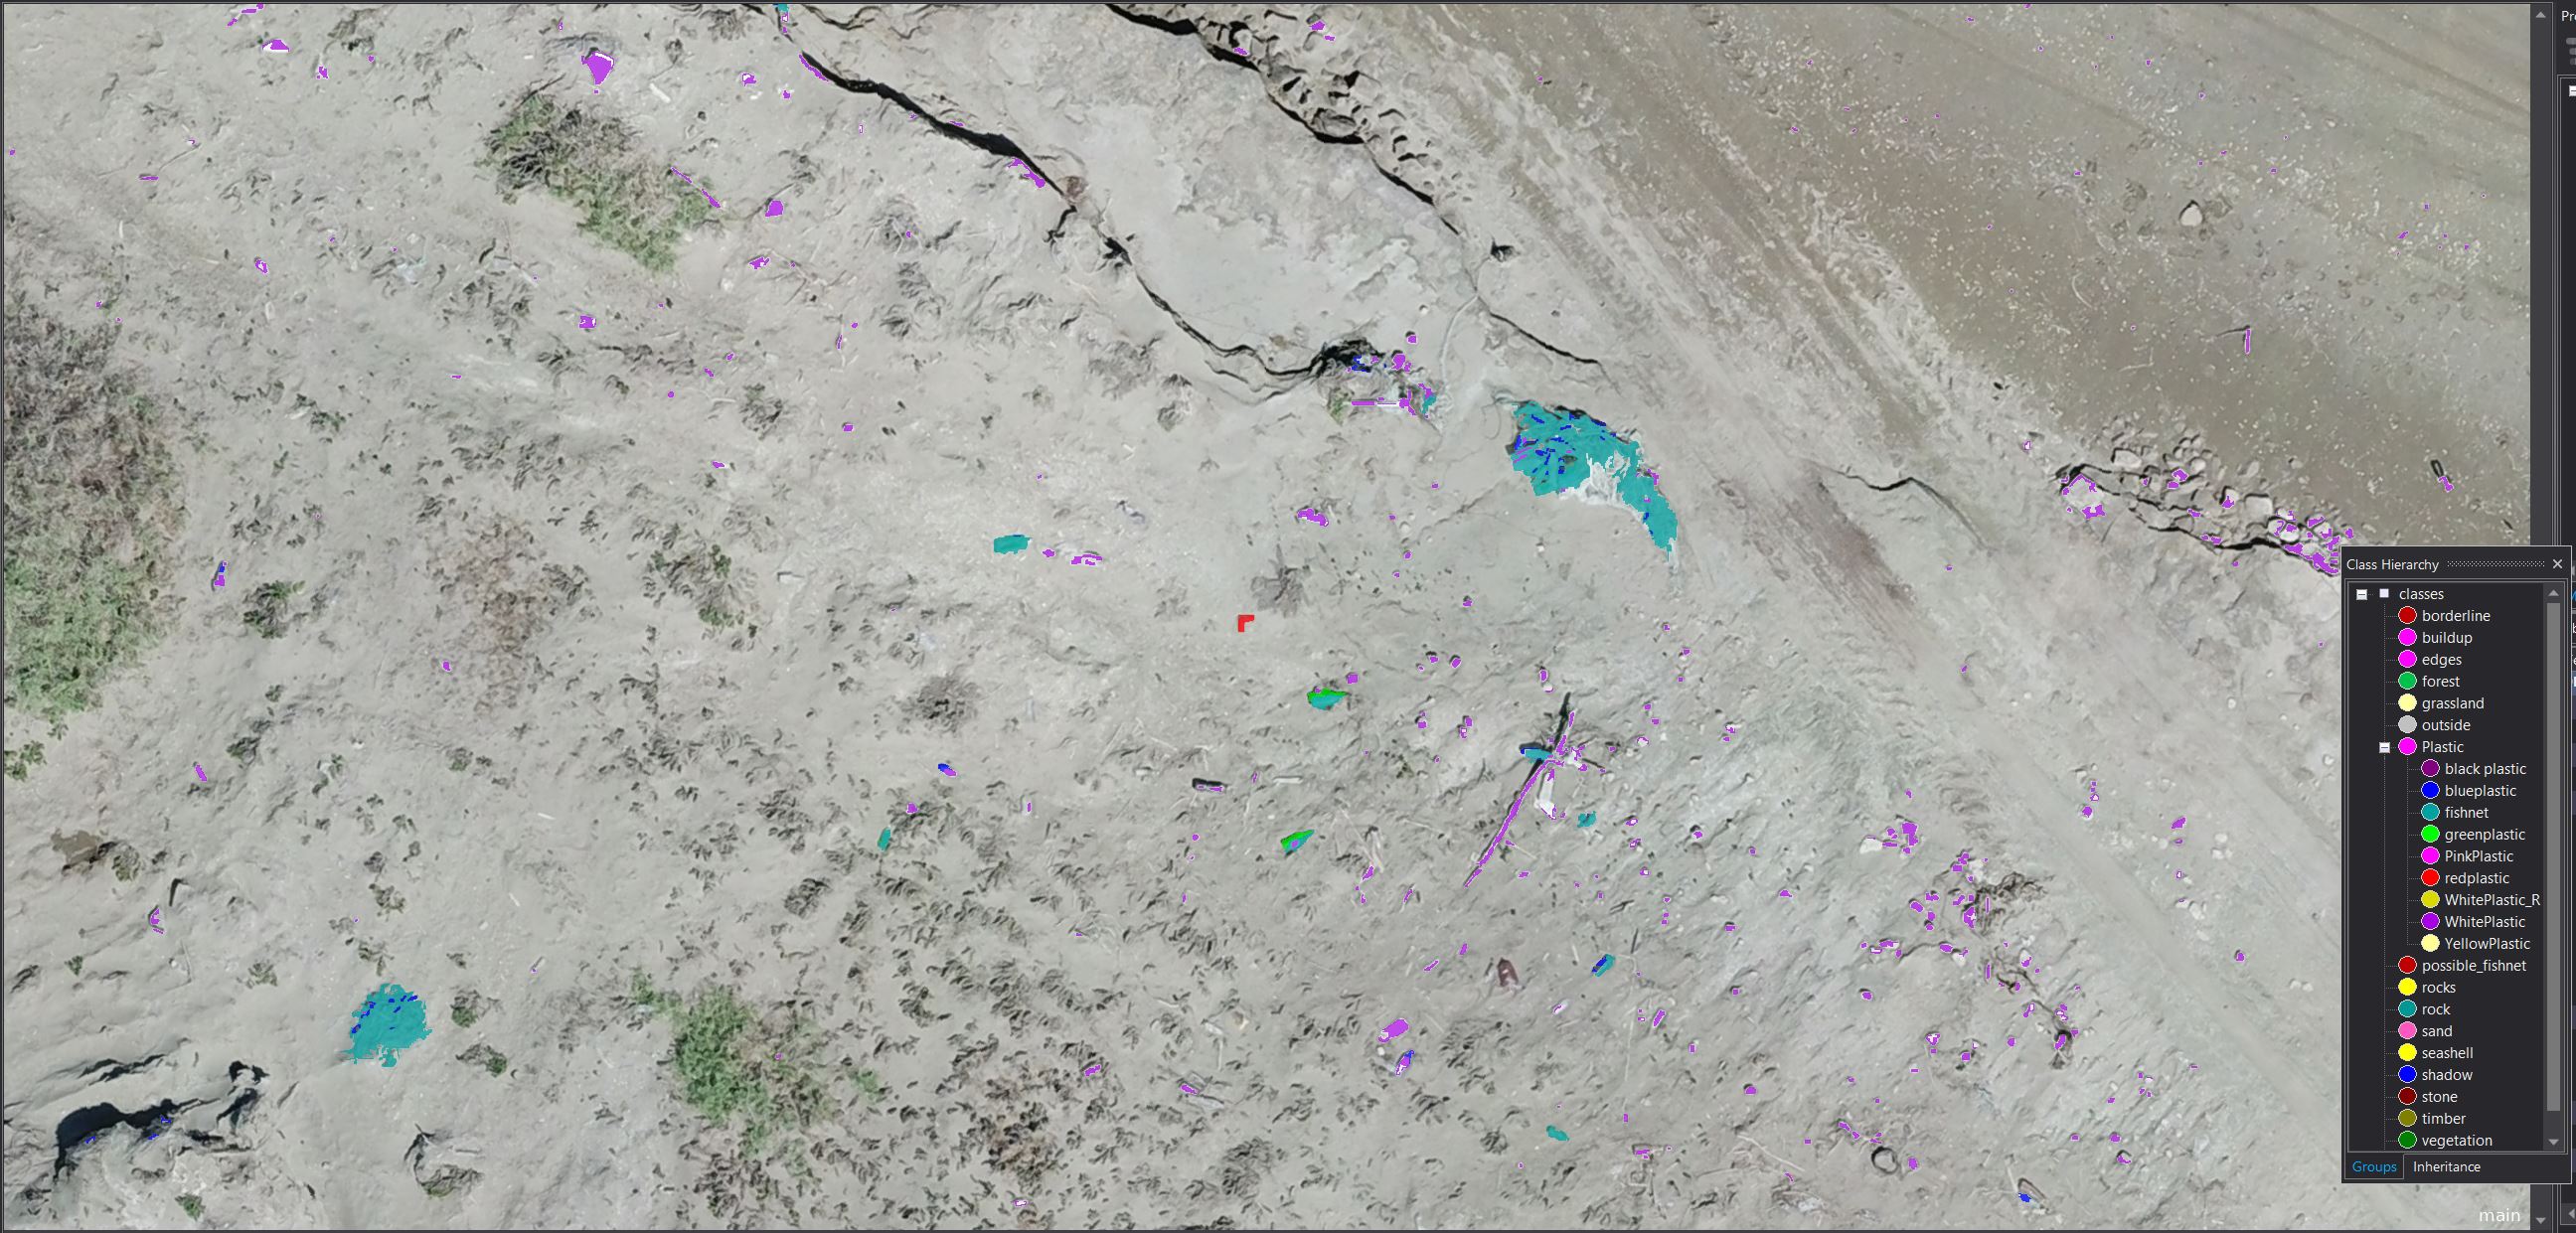
The main objective for image analysis was to detect plastic and fishnet on the beach. The most important object, fishnet, was easily detected. Even small parts of fishnet not visible to human eye, was detected by eCognition analytical tools. Blue, black, red, green and other coloured plastic was detected. The only difficult object was white plastic that was very similar to white stones.
|
|
|
|
|
|
|
Akvaplan-niva Criptic pages |
|
|
|
Links |
Field study
|
|
|
|
|
|
|
|
Stora Enso gremeniella attacks |
|
|
Gremeniella attacks: |
 |
|
|
|
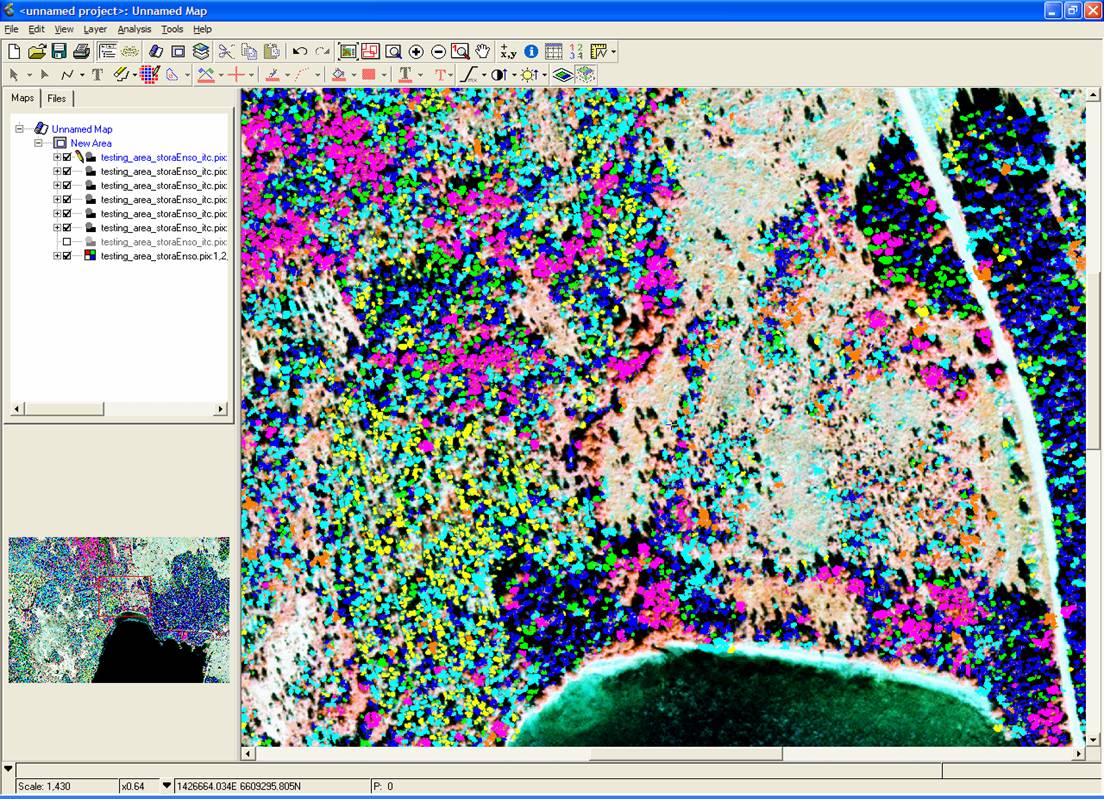
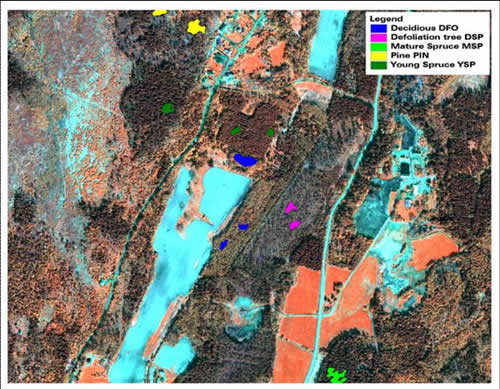
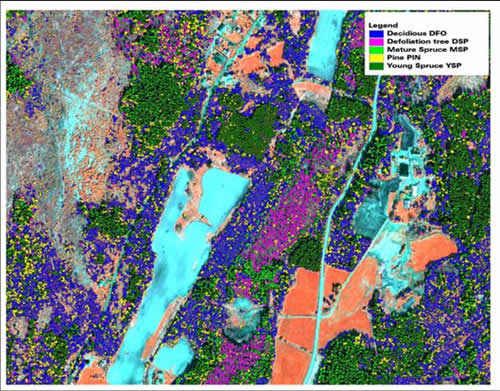
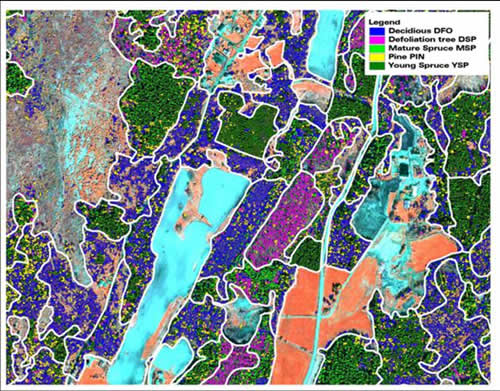
The Gremeniella project for the Swedish company Stora Enso, we showed that it is possible to map individual trees,
determine tree species and which trees were sick or dead. The project was run in connection with a major greminal attack. |
|
|
|
|
|
|
|
|
|
|
|
LKAB measurment of decreases in Kiruna |
|
|
Use of reflectors to return radar signals |
|
|
| |
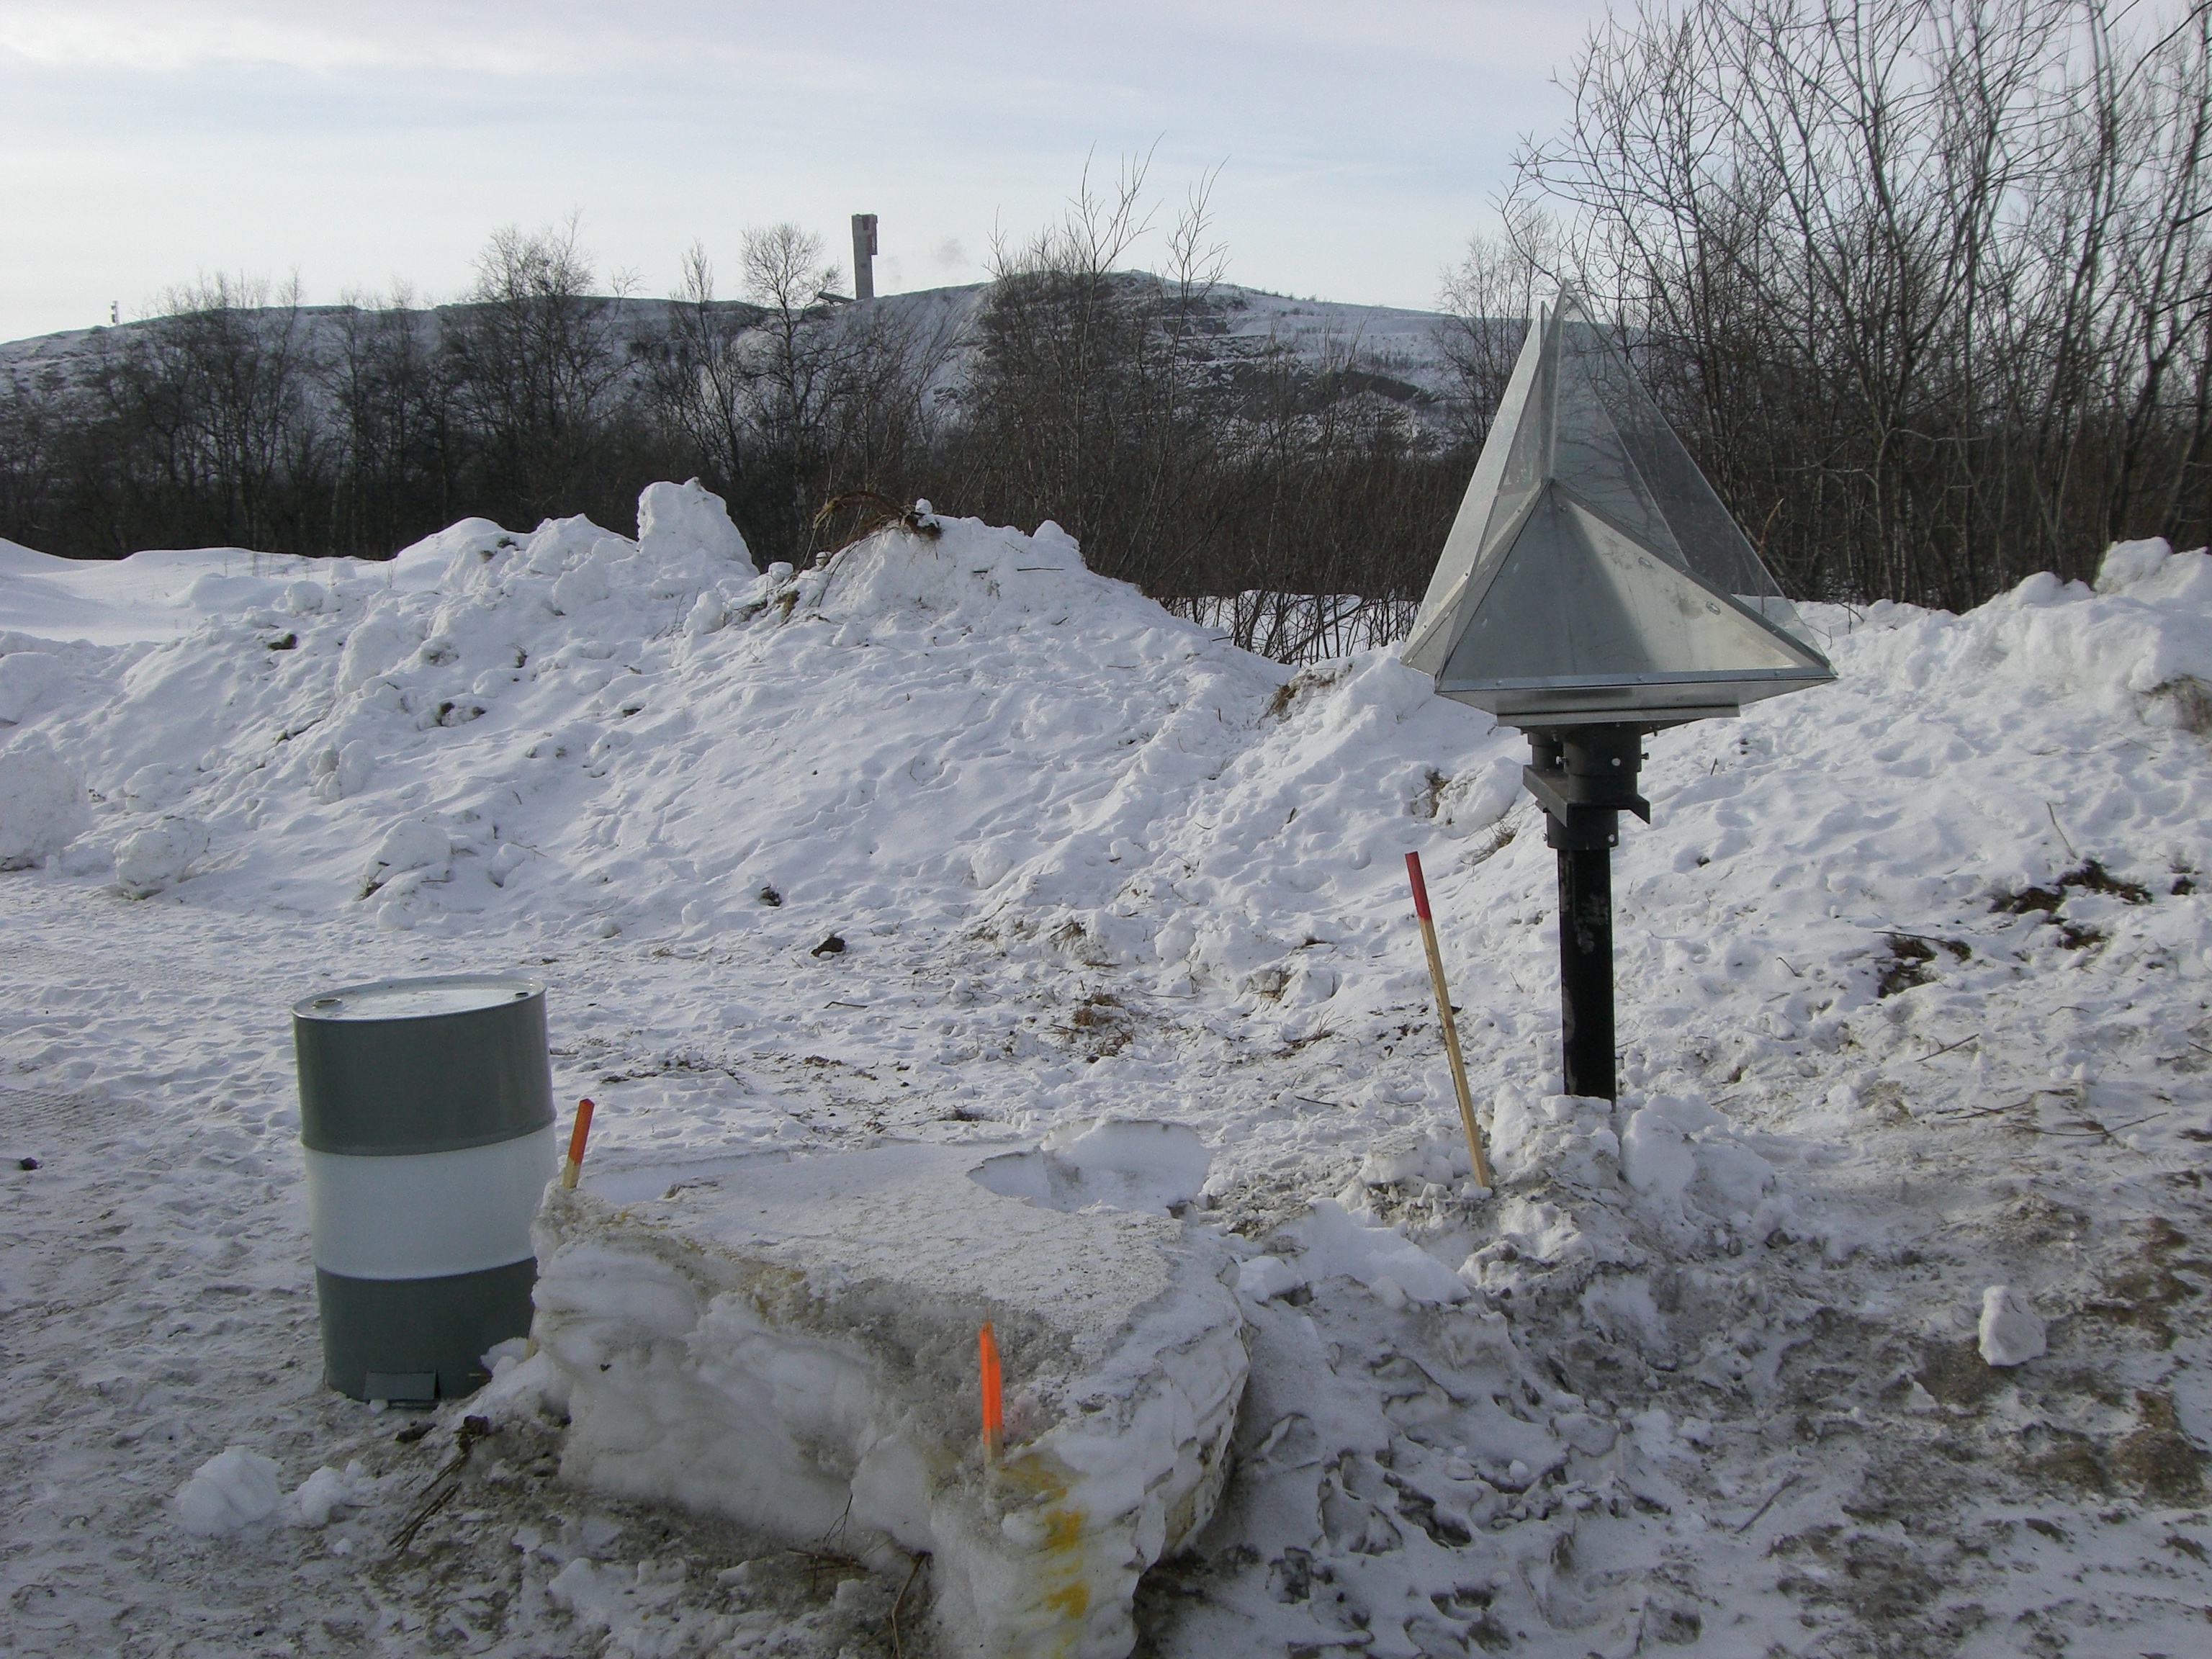
Radar reflector with a surveyed GPS position.
A new ore has been found in the mines in Kiruna, Sweden. The ore goes under the city. When excavated, the city sinks and the entire city must actually be moved. In this process, LKAB measures the lowering in several ways, including radar satellite. TerraNor was given the task of placing reflectors that help with accurate measurements in given locations.. |
|
|
|
|
|
|
|
|
|
|
|
How to detect bark beetle attacks in Sweden attacks in Sweden |
|
|
Detect dead and affected trees with ADS 80 sensor from Leica. A project for Swedish Skogsstyrelsen |
This report must be evaluated with the report with the study of Leica ADS 80 sensor images below. They covered the same area and the result was very similar. Both GeoEye and Leica ADS 80 sensor are excellent scanners and well suited for forest mapping.
This report mention briefly the difference between line scanners or push broom scanners and frame cameras. We need to thank
Pierre Labrecque and Alain Gingrais, owners of iCtrees that really did some very good studies using ADS 80. TerraNor learned a lot from them
and their consultant Michel Guerin.
Full article here
|
|
|
|
|
|
|
How to detect Ips typographus L., Spruce bark beetle on GeoEye imagery |
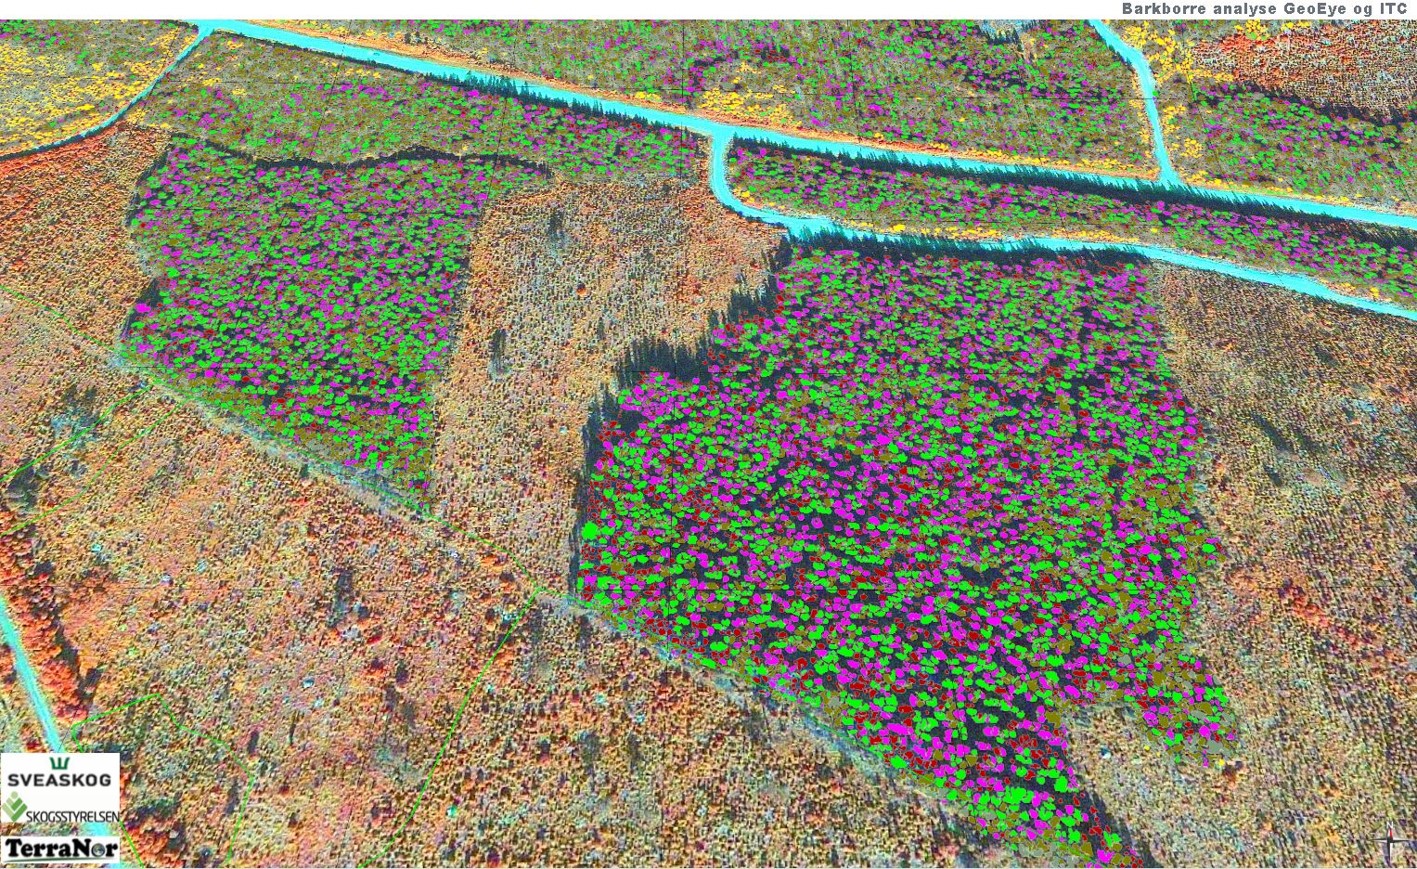
This is a summary in English from a presentation held at EUSI international meeting in June 2013. It must be read together with the report above using Leica ADS 80 sensor.
Michel Guerin did the ITC work using PCI Geoamatica and software from Ph.D Francois Gougeon at the Canadian Forest Service. For more scientific articles, please google "Francois Gougeon".
Full article here
|
|
|
|
|
|
|
Forest mapping with eCognition Developer |
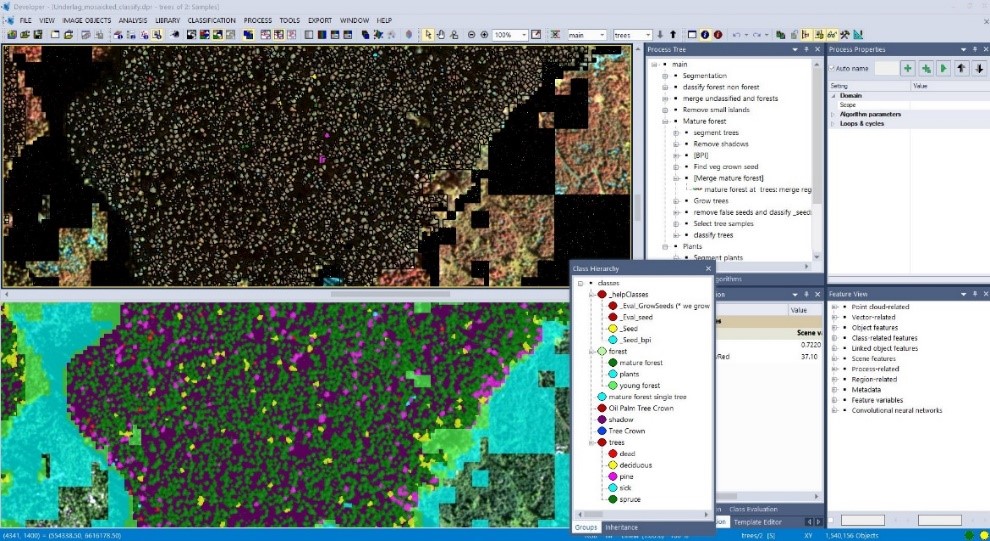
TerraNor has created a ruleset in eCognition which divides the forest into forest stands and then into single trees. Course participants go through each step of the process that can be run fully automatically. Here we describe the process.
Full article here
|
|
|
|
|
|
|
Requirements for the quality of digital data for analysis |
After doing several projects using digital images in Swedish forestry, we sat down with Lantmäteriet (LM) and Stora Enso to discuss what Swedish forestry needs for digital images, or more correctly: what requirements should Swedish forestry place for digital supplies from LM. LM asked for proposals for deliveries and production lines. LM later included most of our proposals in its production line. If you need to order pictures from LM, EUSI or other private actors, this document can give you an overview of concepts that are important.
Full article here
|
|
|
|
|
|
|
|
|
|
|
TerraNor sells satellite images to Swedish Sveaskog |
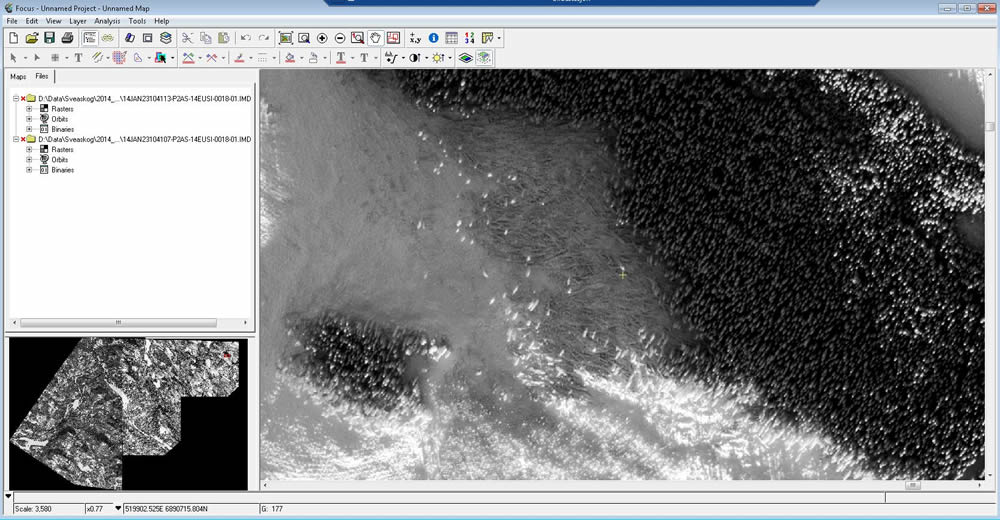
During the storms Hilde and Ivar (2013/2014), a lot of forest fell in Sweden. This press release shows a photo we took with World-View 2 to find the windfall forest.
Full article here
|
|
|
|
|
|
|
|
ITC, a new and modern method of forest mapping |
|
|
|
This is ITC developed in eCogntion:
Full article here
|
|
|
|
TerraNor offer complete forest survey/mapping
based on new techniques of analysis
of digital image data. With high-resolution data from satellite or aircraft sensors,
we can do classification of tree species, division into stock, calculation of
tree species distribution, volume, forest damage and crown cover.
Important: A good result requires good digital data. TerraNor provides
advice on what data can be used for different types of mapping. A 'pretty picture' is
not necessarily the same as good data. Ask us before you spend money on the sensor
data (digital images), it can pay off. |
|
|
|
'Individual Tree Crown classification' (ITC) is a forest mapping method that divides the forest into single trees. After the classification, classification is run and
determination of tree species for each tree. With all the trees determined by size and tree species, you share
forest into stock. See the photo series below. In the menu of
On the left you can select technical articles and look at examples.
|
|
|
|
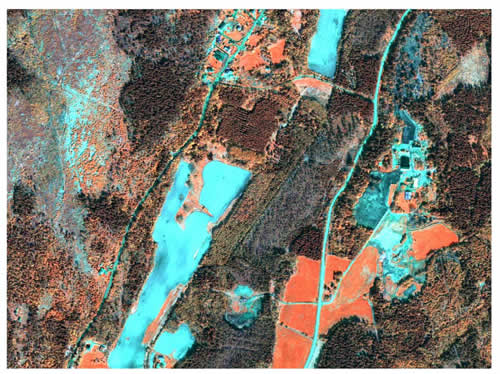
The starting point is a high-resolution digital image. Both satellite and airborne sensors
can be used. This is a satellite scene taken with QuickBird (Maridalen May 2003).
The resolution is 0.61m in PAN (black and white) and 2.4m in MS (color). |
|
|
|
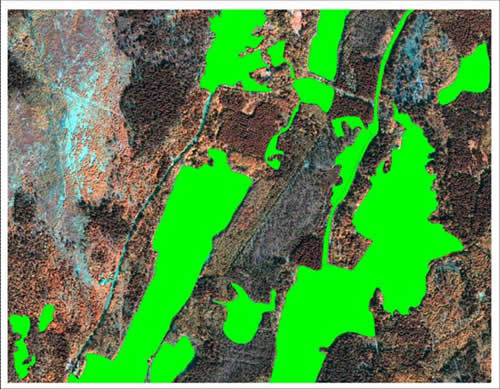
Before the division we mask out all areas that are not forests. This makes it easier
to make a good classification. At the same time, customers get updated maps with water, marsh,
roads, plots etc |
|
|
|
The next step is the division of the forest into individual trees. ITC uses a technique
with analysis of the shadows around the trees to determine each tree. See documentation
in the menu on the left. |
|
|
|
To be able to divide the trees into correct classes, we need sample surfaces from fields.
In the test areas, we determine tree species with distribution within the surface. operator
uses the information further in the classification. |
|
|
|
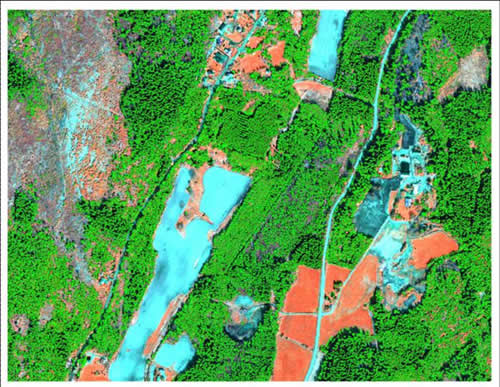
Using the test surfaces, the forest is classified. Which classes to map,
determined by the forest owner. In the Nordic countries there are the usual spruce, pine and pine. In Canada
it is common to classify with 4-5 different hardwoods and 4-5 different softwoods. IN
We have also included this example with older sick spruce forests. Forest damage such as drought
and fungis, are relatively easy to remove if visible in the infrared channels. |
|
|
|
The stock is subdivided at the request of the forest owner. Usually wood species and trees are used
size / age as a classification criterion. In addition, we can use factors such as height
above sea level, steepness, quality, direction, geology etc. The size of the stock may vary
0.5 ha and above.
|
|
|
|
The analysis results in one database with information on each stock.
Databasen contains this info:
|
Area_ha: |
polygon area (ha) |
|
Area_sq_m: |
polygon area (m2) |
|
ITCS: |
total number of ITC crowns |
|
Closure: |
total % of crown cover |
|
Density: |
total stem density (stems / ha) |
|
Sp01: |
tree species # 1 |
|
ITCs01: |
total number of ITC tree crowns for tree species # 1 |
|
Per01: |
% of specie type 1 crowns out of total ITC crowns |
|
CC01: |
% crown cover for specie 1 |
|
Sd01: |
stem density for specie 1 (stems/ha) |
|
Dia01: |
middle crown diameter for specie 1 |
|
Sp02: |
specie # 2 |
|
ITCs02: |
total number of ITC tree crowns for tree species nr 2 |
|
Per02: |
% of specie type 2 crowns out of total ITC crowns |
|
etc…
|
|
Together with tree heights available from Laser / Lidar or statistical field measurements /
image measurements, one can calculate the volume of the different species of wood in the stock.
|
|
|
|
|
|